OPEN-SOURCE SCRIPT
Обновлено [Suitable Hope] Crypto Upside Model 3.0
The "Crypto Upside Model 3.0" indicator dynamically calculates the potential price of any cryptocurrency based on various percentages of Ethereum or Bitcoin's market capitalization.
By fetching and analyzing marketcap data from TradingView sources, it allows traders to visualize potential price targets if their chosen cryptocurrency reaches specific market dominance levels. This tool is designed for daily timeframe analysis and can be used to set informed price expectations and strategic investment goals, providing valuable insights for long-term investment planning.
Why using the Crypto Upside Model 3.0?
Comparative Advantage
User Instructions
Limitations
Final notes
Although various sources ask a payment or user data for similar kind of private indicators, this one is entirely free and open source. "Uncanny" isn't it? I hope this indicator will provide you value. Feel free to leave a message if you have any questions or constructive feedback.
Examples of how I use this indicator

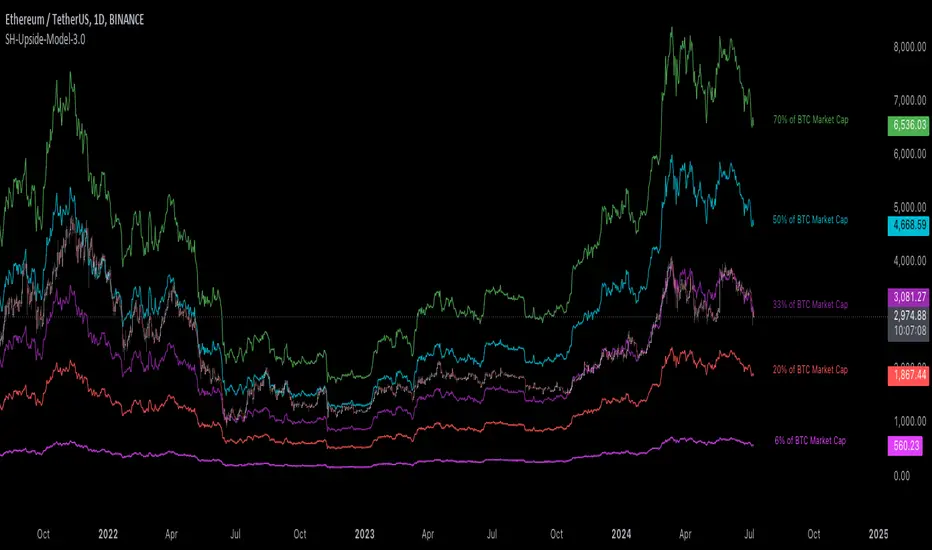
When using ETH's historical price as a reference compared to Bitcoin's marketcap, we can notice that price generally has been held between the +-30% and 50% lines of BTC's marketcap. If history is repeating again, we can expect major resistances around the 50% looking ahead into the future. This for me would be a great area to potentially reduce my ETH spot position.

When using SOL's historical price action, we can notice that the 15% line of ETH's marketcap has been a top in the previous cycle. Today SOL (July 2024), is back at this level. Could this be a top again or could price break this 15% level and head perhaps towards 30% which currently sits around $260? Time will tell.
These are 2 simple example of how I interpret the data. I'm keen to hear what other findings with other pairs you can find.
By fetching and analyzing marketcap data from TradingView sources, it allows traders to visualize potential price targets if their chosen cryptocurrency reaches specific market dominance levels. This tool is designed for daily timeframe analysis and can be used to set informed price expectations and strategic investment goals, providing valuable insights for long-term investment planning.
Why using the Crypto Upside Model 3.0?
- Strategic Planning: Helps traders and investors set realistic price targets and investment goals by visualizing potential market cap scenarios.
- Informed Decision-Making: Provides a data-driven approach to understanding how a cryptocurrency might perform relative to major assets like Bitcoin and Ethereum.
- Customizable Analysis: Allows users to choose different comparison assets (ETH or BTC) and visualize various market cap dominance percentages, offering tailored insights.
- Daily Timeframe Focus: Ideal for swing traders and long-term investors who operate on a daily analysis timeframe, providing relevant and actionable data.
- Bull Markets: Identify potential price targets if your cryptocurrency's market cap increases significantly.
- Bear Markets: Assess how much value could be retained relative to major cryptocurrencies.
- Strategic Entry/Exit Points: Use the visualized targets to plan entry or exit points in your trading strategy.
Comparative Advantage
- Dynamic Adaptation: Unlike fixed indicators, this tool adapts to any active chart, making it versatile for multiple cryptocurrencies.
- Market Cap Insights: Provides a unique perspective by linking price targets to market cap dominance, a critical factor in the crypto market.
User Instructions
- Setup: Add the "[Suitable Hope] Upside Model 3.0" indicator to your TradingView chart.
- Configuration: Use the input settings to select the comparison cryptocurrency (ETH or BTC) and enable the desired market cap percentage plots.
- Analysis: The indicator will display potential price targets based on the selected market cap percentages, providing a visual guide for setting price expectations.
Limitations
- Marketcap Data Availability: The indicator relies on marketcap data from TradingView, which may not be available for all cryptocurrencies. If the data is unavailable, the indicator will not function for that asset. This tool is more likely to work with older, established cryptocurrencies, as marketcap data for newer cryptocurrencies may not yet be available.
- Daily Timeframe Restriction: The indicator is designed to work exclusively on the daily timeframe, limiting its applicability for intraday trading.
- Assumptions of Market Dynamics: The calculations assume a direct correlation between market dominance and price, which may not account for other market dynamics and external factors influencing prices.
- Data Accuracy: The accuracy of the indicator depends on the reliability of the data provided by TradingView, which may sometimes experience delays or inaccuracies.
- Currently available cryptocurrencies: Bitcoin, Ethereum, Solana, Binance Coin, Cardano, Ripple, Polkadot, Avalanche, Chainlink, Litecoin, Dogecoin, Terra, Uniswap, VeChain, Stellar, Internet Computer, Hedera, Filecoin, Monero, Aave, TRON, NEAR Protocol, Compound, Maker,... For all compatible cryptocurrencies, please consult CRYPTOCAP's documentation.
Final notes
Although various sources ask a payment or user data for similar kind of private indicators, this one is entirely free and open source. "Uncanny" isn't it? I hope this indicator will provide you value. Feel free to leave a message if you have any questions or constructive feedback.
Examples of how I use this indicator
When using ETH's historical price as a reference compared to Bitcoin's marketcap, we can notice that price generally has been held between the +-30% and 50% lines of BTC's marketcap. If history is repeating again, we can expect major resistances around the 50% looking ahead into the future. This for me would be a great area to potentially reduce my ETH spot position.
When using SOL's historical price action, we can notice that the 15% line of ETH's marketcap has been a top in the previous cycle. Today SOL (July 2024), is back at this level. Could this be a top again or could price break this 15% level and head perhaps towards 30% which currently sits around $260? Time will tell.
These are 2 simple example of how I interpret the data. I'm keen to hear what other findings with other pairs you can find.
Информация о релизе
- Minor update related to feedback from pinecoders
Информация о релизе
- Minor update: Chart screenshot update
Скрипт с открытым кодом
В истинном духе TradingView, создатель этого скрипта сделал его открытым исходным кодом, чтобы трейдеры могли проверить и убедиться в его функциональности. Браво автору! Вы можете использовать его бесплатно, но помните, что перепубликация кода подчиняется нашим Правилам поведения.
Отказ от ответственности
Информация и публикации не предназначены для предоставления и не являются финансовыми, инвестиционными, торговыми или другими видами советов или рекомендаций, предоставленных или одобренных TradingView. Подробнее читайте в Условиях использования.