MTF Lag-Less RasterChart (Spectrogram/HeatMap)
I once again would like to personally thank Dr . John Ehlers for inspiring me to ponder into the realm of heatmap technology and all it has to offer. Your mathemagical splendor is most appreciated! You're a divine inspiration to the algorithmic trading community and forever shall be.
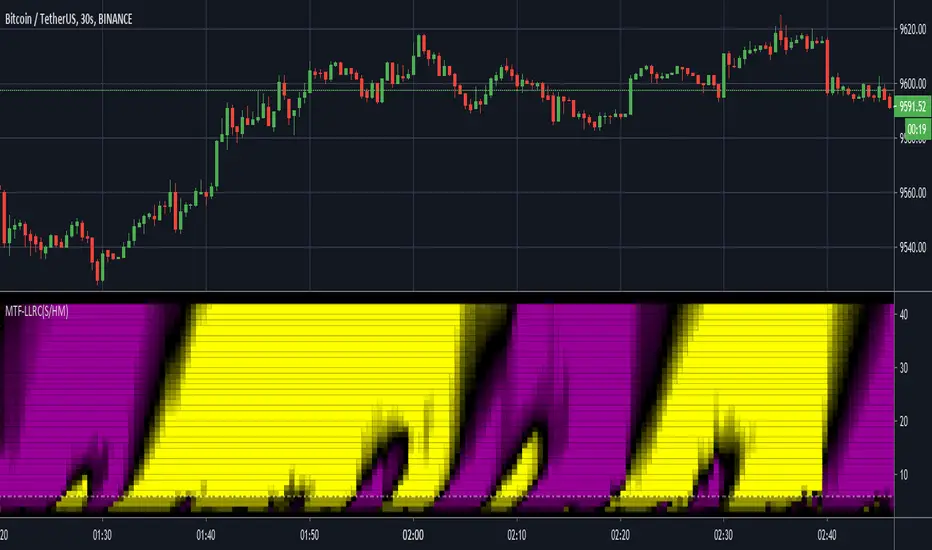
The MTF capabilities include seconds, minutes, and days. If the time frame settings are shorter in time than the current sampling interval, a warning notification will be appropriately displayed. I included a horizontal rule to approximately gauge at what level you may wish to have before entering/exiting a trade upon identifying a trend change. This gizmo functions on all assets on time frames ranging from one second bars up to the "All" chart having monthly bars.
Lastly, I have included so many color scheming techniques that I couldn't demonstrate all of them above. This indicator has what I would term as enhanced "predator" vision. For those of you who have witnessed these movies, you may understand what I have built. This indicator additionally includes a color morphing control to perfectly adjust the gradients to your visual liking, on any time frame whether it be seconds or daily chart preferences. The use of this indicator is just like any of my other RasterCharts or heatmap indicators found on the internet, except it has the greatest versatility I have accomplished as of yet.
Features List Includes:
"Source" selection
MTF controls for seconds, minutes, and days
Adjustable horizontal rule to differentiate between more reactive aspects of turning point fluctuations in the lower portion of the chart (visible above)
Window aperture control
Adjustable heatmap brightness control
Visual color scheme techniques (a few of many are displayed above)
Color gradient morphing
Color inversion control
This is not a freely available indicator, FYI. To witness my Pine poetry in action, properly negotiated requests for unlimited access, per indicator, may ONLY be obtained by direct contact with me using TV's "Private Chats" or by "Message" hidden in my member name above. The comments section below is solely just for commenting and other remarks, ideas, compliments, etc... regarding only this indicator, not others. When available time provides itself, I will consider your inquiries, thoughts, and concepts presented below in the comments section, should you have any questions or comments regarding this indicator. When my indicators achieve more prevalent use by TV members, I may implement more ideas when they present themselves as worthy additions. As always, "Like" it if you simply just like it with a proper thumbs up, and also return to my scripts list occasionally for additional postings. Have a profitable future everyone!
Скрипт с ограниченным доступом
Доступ к этому скрипту имеют только пользователи, одобренные автором. Вам необходимо запросить и получить разрешение на его использование. Обычно оно предоставляется после оплаты. Для получения подробной информации следуйте инструкциям автора ниже или свяжитесь напрямую с ImmortalFreedom.
TradingView НЕ рекомендует оплачивать или использовать скрипт, если вы полностью не доверяете его автору и не понимаете, как он работает. Вы также можете найти бесплатные, открытые альтернативы в наших скриптах сообщества.
Инструкции от автора
Отказ от ответственности
Скрипт с ограниченным доступом
Доступ к этому скрипту имеют только пользователи, одобренные автором. Вам необходимо запросить и получить разрешение на его использование. Обычно оно предоставляется после оплаты. Для получения подробной информации следуйте инструкциям автора ниже или свяжитесь напрямую с ImmortalFreedom.
TradingView НЕ рекомендует оплачивать или использовать скрипт, если вы полностью не доверяете его автору и не понимаете, как он работает. Вы также можете найти бесплатные, открытые альтернативы в наших скриптах сообщества.