OPEN-SOURCE SCRIPT
Stochastic Barcolor 2021-5-22
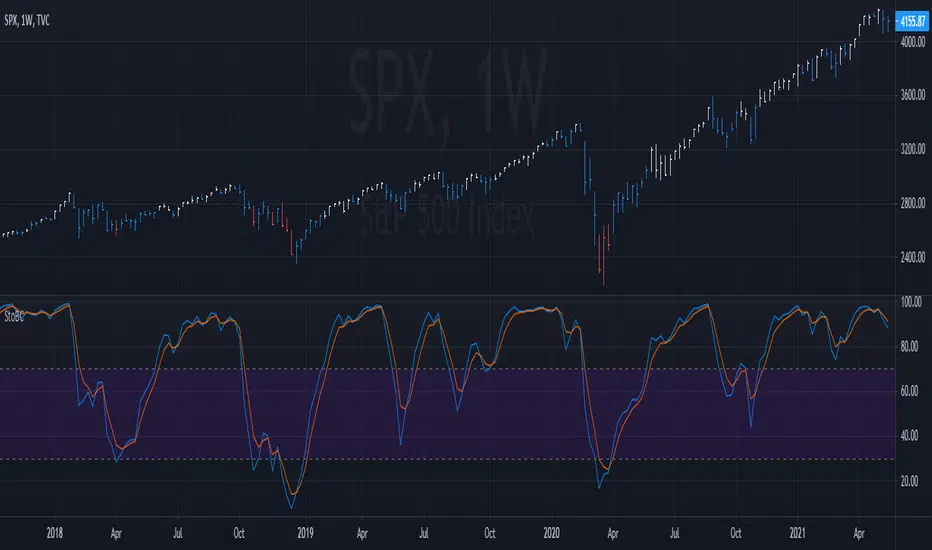
This one is the stochastic with barcolor added to it. In this example, the bars are white when the stochastic line is above is above both 70 AND its signal (vice-versa the bars are red). Adjust the lines and overbought/oversold levels however you see fit for your needs. On higher time frames, this can be used to spot the most bullish/bearish trends. On lower time frames it can be used to take profits. This setting is most effective when used on multiple time frames. Enjoy!
Скрипт с открытым кодом
В истинном духе TradingView автор этого скрипта опубликовал его с открытым исходным кодом, чтобы трейдеры могли понять, как он работает, и проверить на практике. Вы можете воспользоваться им бесплатно, но повторное использование этого кода в публикации регулируется Правилами поведения.
Отказ от ответственности
Все виды контента, которые вы можете увидеть на TradingView, не являются финансовыми, инвестиционными, торговыми или любыми другими рекомендациями. Мы не предоставляем советы по покупке и продаже активов. Подробнее — в Условиях использования TradingView.