OPEN-SOURCE SCRIPT
Обновлено Market Trend and Squeeze Indicator MTF - Optimized v3
1. Overview
This indicator is designed to identify market trends and consolidation phases using a combination of:
ADX (Average Directional Index) → Measures trend strength.
Keltner Channels (KC) → Helps identify trend channels.
Bollinger Bands (BB) → Measures volatility and price squeeze.
Squeeze Momentum → Determines when the market is “coiling” for a breakout.
Multi-Timeframe Analysis (MTF) → Shows these signals across different timeframes in one table.
Essentially, it tells you whether the market is trending up, trending down, consolidating, or neutral, while also giving a squeeze strength index.
2. Key Components
A. ADX (Trend Strength)
Trending Up / Down: ADX above the trending threshold (default 25).
Consolidating: ADX below the consolidation threshold (default 20).
This helps filter strong trends from weak or sideways markets.
B. Keltner Channels & Bollinger Bands (Squeeze Detection)
Keltner Channels (KC): Shows the average price range using ATR (volatility).
Bollinger Bands (BB): Shows volatility using standard deviation.
Squeeze condition: When BB is inside KC, the market is in a low-volatility consolidation phase, often leading to a breakout.
C. Squeeze Momentum
Measures whether the market is building upward or downward momentum during a squeeze.
Green/blueish colors indicate a strong potential upward breakout, while reddish/pinkish colors indicate potential downward breakout.
D. Multi-Timeframe Table
Shows trend and squeeze status across multiple timeframes (1M, 3M, 5M, 15M, 30M, 1H by default).
Helps traders see both short-term and longer-term trends at a glance.
E. Squeeze Gauge
Displays a 10-point squeeze index for the current timeframe:
Higher value = stronger squeeze.
Colored gradient shows the squeeze strength visually.
3. How to Read the Indicator
A. Trend & Squeeze Table
Each row represents a timeframe.
Cell colors:
Green → Trending Up
Red → Trending Down
Blue/Purple Gradient → Consolidating (squeeze)
Gray → Neutral
Numbers in cells:
Trending → Trend strength (1–10)
Consolidating → Squeeze index (1–10)
This lets you quickly see:
Which timeframes are trending
Which are in consolidation
The relative strength of trends or squeeze
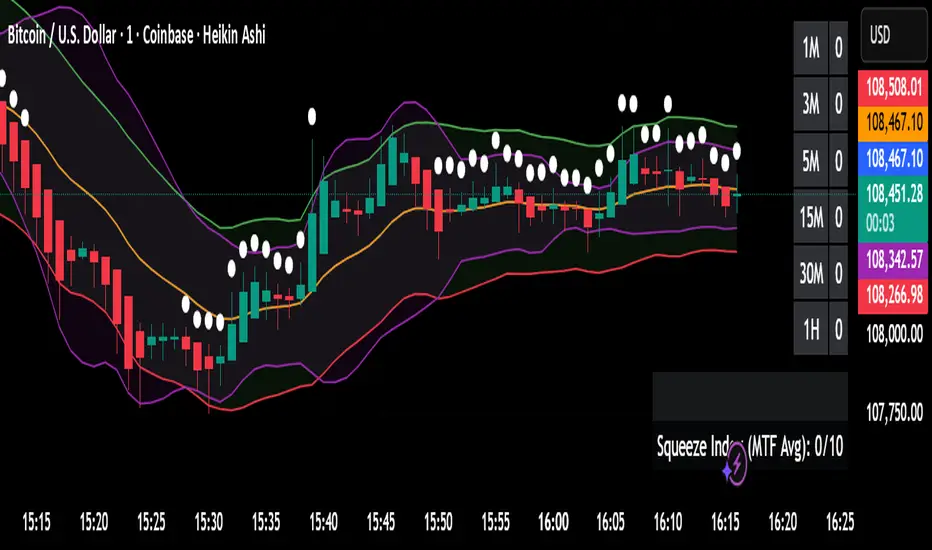
B. Chart Plots
Keltner Channels (green/red lines) → Trend envelopes
Bollinger Bands (purple) → Volatility envelopes
White dots → Market is currently in a squeeze
ADX reference lines → Trend vs consolidation thresholds
C. Alerts
Alerts are triggered when:
Market starts trending (up or down)
Market starts consolidating
4. How Traders Can Use It
Trend Following
Enter trades in the direction of the trend:
Green table → buy / long
Red table → sell / short
Use trend strength numbers to confirm trend strength.
Breakout Strategy
When the squeeze (blue/purple) appears:
Watch for a breakout above/below KC or BB
Use momentum to anticipate direction (green = up, red = down)
Multi-Timeframe Confirmation
Only take trades when multiple timeframes align:
Example: 15M, 30M, and 1H all trending up → stronger buy signal
Mixed signals → avoid trading (market may be choppy)
Risk Management
Use KC or BB levels for stop-loss and target placement
ADX thresholds help avoid entering weak trends
5. Settings Traders Can Adjust
Setting Default Use
ADX Length 14 How sensitive trend detection is
ADX Trend Threshold 25 Minimum ADX for trend recognition
ADX Consolidation Threshold 20 Maximum ADX for considering consolidation
KC Length / Multiplier 20 / 1.5 Adjust channel sensitivity
BB Length / Multiplier 20 / 2 Adjust volatility detection
Squeeze Length 20 Number of bars for squeeze calculation
Table / Gauge Position Top Right / Bottom Right Place tables anywhere on chart
6. Summary
Green → Strong upward trend
Red → Strong downward trend
Blue/Purple → Consolidation / Squeeze
Gray → Neutral / weak movement
Squeeze Index → Measures how compressed price action is (1–10)
Multi-timeframe table → Quickly see trends and squeezes across all timeframes
This indicator is perfect for trend-followers and breakout traders who want visual clarity across multiple timeframes in one glance.
This indicator is designed to identify market trends and consolidation phases using a combination of:
ADX (Average Directional Index) → Measures trend strength.
Keltner Channels (KC) → Helps identify trend channels.
Bollinger Bands (BB) → Measures volatility and price squeeze.
Squeeze Momentum → Determines when the market is “coiling” for a breakout.
Multi-Timeframe Analysis (MTF) → Shows these signals across different timeframes in one table.
Essentially, it tells you whether the market is trending up, trending down, consolidating, or neutral, while also giving a squeeze strength index.
2. Key Components
A. ADX (Trend Strength)
Trending Up / Down: ADX above the trending threshold (default 25).
Consolidating: ADX below the consolidation threshold (default 20).
This helps filter strong trends from weak or sideways markets.
B. Keltner Channels & Bollinger Bands (Squeeze Detection)
Keltner Channels (KC): Shows the average price range using ATR (volatility).
Bollinger Bands (BB): Shows volatility using standard deviation.
Squeeze condition: When BB is inside KC, the market is in a low-volatility consolidation phase, often leading to a breakout.
C. Squeeze Momentum
Measures whether the market is building upward or downward momentum during a squeeze.
Green/blueish colors indicate a strong potential upward breakout, while reddish/pinkish colors indicate potential downward breakout.
D. Multi-Timeframe Table
Shows trend and squeeze status across multiple timeframes (1M, 3M, 5M, 15M, 30M, 1H by default).
Helps traders see both short-term and longer-term trends at a glance.
E. Squeeze Gauge
Displays a 10-point squeeze index for the current timeframe:
Higher value = stronger squeeze.
Colored gradient shows the squeeze strength visually.
3. How to Read the Indicator
A. Trend & Squeeze Table
Each row represents a timeframe.
Cell colors:
Green → Trending Up
Red → Trending Down
Blue/Purple Gradient → Consolidating (squeeze)
Gray → Neutral
Numbers in cells:
Trending → Trend strength (1–10)
Consolidating → Squeeze index (1–10)
This lets you quickly see:
Which timeframes are trending
Which are in consolidation
The relative strength of trends or squeeze
B. Chart Plots
Keltner Channels (green/red lines) → Trend envelopes
Bollinger Bands (purple) → Volatility envelopes
White dots → Market is currently in a squeeze
ADX reference lines → Trend vs consolidation thresholds
C. Alerts
Alerts are triggered when:
Market starts trending (up or down)
Market starts consolidating
4. How Traders Can Use It
Trend Following
Enter trades in the direction of the trend:
Green table → buy / long
Red table → sell / short
Use trend strength numbers to confirm trend strength.
Breakout Strategy
When the squeeze (blue/purple) appears:
Watch for a breakout above/below KC or BB
Use momentum to anticipate direction (green = up, red = down)
Multi-Timeframe Confirmation
Only take trades when multiple timeframes align:
Example: 15M, 30M, and 1H all trending up → stronger buy signal
Mixed signals → avoid trading (market may be choppy)
Risk Management
Use KC or BB levels for stop-loss and target placement
ADX thresholds help avoid entering weak trends
5. Settings Traders Can Adjust
Setting Default Use
ADX Length 14 How sensitive trend detection is
ADX Trend Threshold 25 Minimum ADX for trend recognition
ADX Consolidation Threshold 20 Maximum ADX for considering consolidation
KC Length / Multiplier 20 / 1.5 Adjust channel sensitivity
BB Length / Multiplier 20 / 2 Adjust volatility detection
Squeeze Length 20 Number of bars for squeeze calculation
Table / Gauge Position Top Right / Bottom Right Place tables anywhere on chart
6. Summary
Green → Strong upward trend
Red → Strong downward trend
Blue/Purple → Consolidation / Squeeze
Gray → Neutral / weak movement
Squeeze Index → Measures how compressed price action is (1–10)
Multi-timeframe table → Quickly see trends and squeezes across all timeframes
This indicator is perfect for trend-followers and breakout traders who want visual clarity across multiple timeframes in one glance.
Информация о релизе
Just a small updateСкрипт с открытым кодом
В истинном духе TradingView автор этого скрипта опубликовал его с открытым исходным кодом, чтобы трейдеры могли понять, как он работает, и проверить на практике. Вы можете воспользоваться им бесплатно, но повторное использование этого кода в публикации регулируется Правилами поведения.
Отказ от ответственности
Все виды контента, которые вы можете увидеть на TradingView, не являются финансовыми, инвестиционными, торговыми или любыми другими рекомендациями. Мы не предоставляем советы по покупке и продаже активов. Подробнее — в Условиях использования TradingView.
Скрипт с открытым кодом
В истинном духе TradingView автор этого скрипта опубликовал его с открытым исходным кодом, чтобы трейдеры могли понять, как он работает, и проверить на практике. Вы можете воспользоваться им бесплатно, но повторное использование этого кода в публикации регулируется Правилами поведения.
Отказ от ответственности
Все виды контента, которые вы можете увидеть на TradingView, не являются финансовыми, инвестиционными, торговыми или любыми другими рекомендациями. Мы не предоставляем советы по покупке и продаже активов. Подробнее — в Условиях использования TradingView.