OPEN-SOURCE SCRIPT
Обновлено Smarter MACD

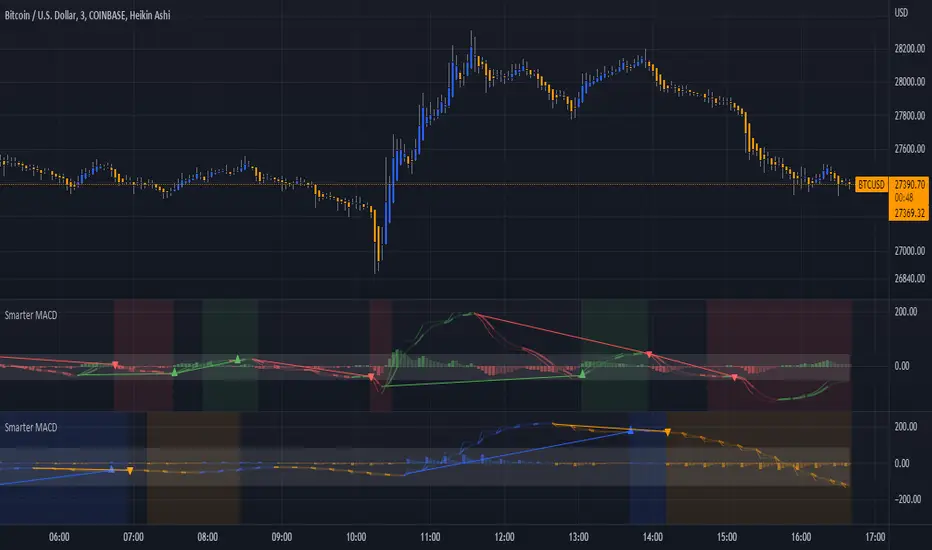
A classic MACD with average peak and dip lines. The lighter green and red horizontal lines are the average peak and dip of the entire span, respectively. The second, bolder of the two lines are the averages of the peaks and dips above and below the overall peak and dip averages. The filled in color is to help visualize these averages and possible trade setups. Rework of the MACD + Averages script.
Информация о релизе
Clarified momentum divergence signalsИнформация о релизе
Clarified momentum divergence markersИнформация о релизе
Added background coloring to better visualize clear bullish or bearish momentumИнформация о релизе
Added background coloring to better visualize clear bullish or bearish momentum, credits, updated indicator preview, and discord link.Don't forget to join the Discord group: discord.gg/fsbbhDZ3
Информация о релизе
Added ATF (Adjustable Time Frame) for detecting confluence with higher timeframes, as well as color controls to differentiate between the two timeframes. By adding two to a chart, you can merge them to create overlaps by clicking on the ellipses on the indicator (...), clicking "Move To", and clicking the "Existing Pane Above" or "Existing Pane Below" options.Скрипт с открытым кодом
В истинном духе TradingView, создатель этого скрипта сделал его открытым исходным кодом, чтобы трейдеры могли проверить и убедиться в его функциональности. Браво автору! Вы можете использовать его бесплатно, но помните, что перепубликация кода подчиняется нашим Правилам поведения.
Отказ от ответственности
Информация и публикации не предназначены для предоставления и не являются финансовыми, инвестиционными, торговыми или другими видами советов или рекомендаций, предоставленных или одобренных TradingView. Подробнее читайте в Условиях использования.
Скрипт с открытым кодом
В истинном духе TradingView, создатель этого скрипта сделал его открытым исходным кодом, чтобы трейдеры могли проверить и убедиться в его функциональности. Браво автору! Вы можете использовать его бесплатно, но помните, что перепубликация кода подчиняется нашим Правилам поведения.
Отказ от ответственности
Информация и публикации не предназначены для предоставления и не являются финансовыми, инвестиционными, торговыми или другими видами советов или рекомендаций, предоставленных или одобренных TradingView. Подробнее читайте в Условиях использования.