PROTECTED SOURCE SCRIPT
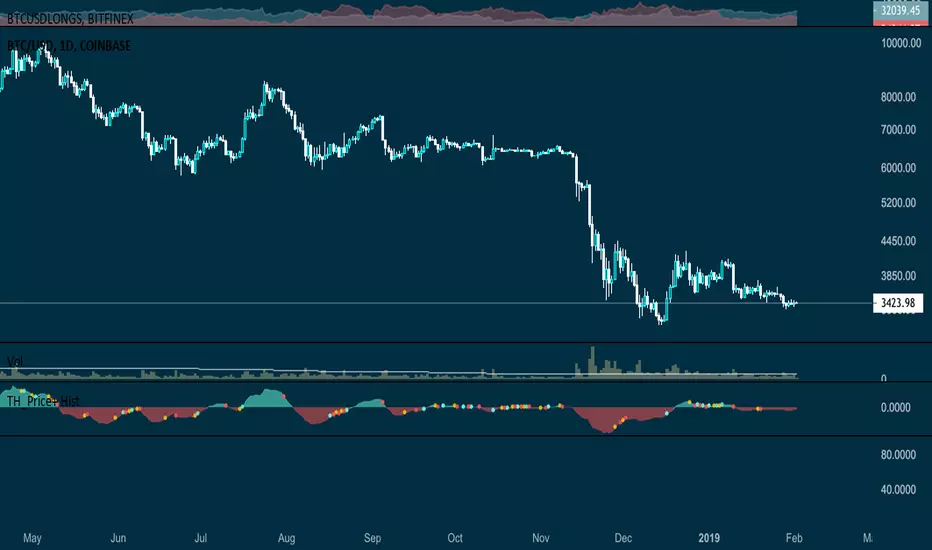
TH_Price+ Histogram

Price plotted into centralized oscillator normalized via 7/14 moving averages. The Histogram reveal longer trends while flags warn for early entry/exits. This script has been backtested with astonishing results particularly on 4H and Daily timeframes.
You can use this in combination with Hull+ or Delta Map (Premium), RSI+ or RSI Delta (Premium) and also OBV+ Histogram for stronger confirmations.
You can use this in combination with Hull+ or Delta Map (Premium), RSI+ or RSI Delta (Premium) and also OBV+ Histogram for stronger confirmations.
Скрипт с защищённым кодом
Этот скрипт опубликован с закрытым исходным кодом. Однако вы можете использовать его свободно и без каких-либо ограничений — читайте подробнее здесь.
D7R
Отказ от ответственности
Информация и публикации не предназначены для предоставления и не являются финансовыми, инвестиционными, торговыми или другими видами советов или рекомендаций, предоставленных или одобренных TradingView. Подробнее читайте в Условиях использования.