PROTECTED SOURCE SCRIPT
Обновлено My new BTC log curve

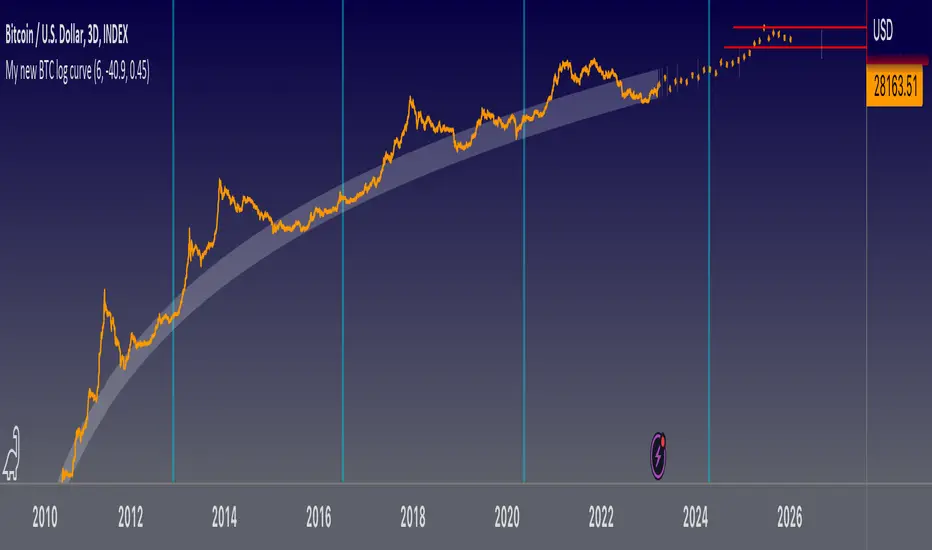
This is my new logarithmic regression curve to the USD/BTC price chart. It is based on a new, very simple equation: y = (e^b)*(x^a), where x is number of days since the Genesis block, a and b are parameters set by the user. Also included is an upper regression curve that is fit to the peaks of each Bitcoin cycle; no fundamental analysis went into making these lines, they are merely fits to the data, so it should not be expected that they can be used to predict tops and bottoms. The upper regression curve is the product of the support curve (lower curve) and two other factors: a constant, and an exponential decay. The constant and the decay factors are parameters that can be set by the user.
Информация о релизе
Fixed top curve; prior version had top curve equal to the support price multiplied by an exponential decay curve which would cause the top curve to eventually fall below support curve and asymptotically approach zero. This version makes the top curve equal to the price multiplied by a constant plus exponential decay curve, so the top curve will always be above the support curve with some margin.Also, the top curve is now a top band, with a thickness (height) that can be changed by the user.
Информация о релизе
Updated the default values. Removed top curve. Added some extrapolation of the support curve on 3-day and weekly charts.Информация о релизе
Fixed script chart.Скрипт с защищённым кодом
Этот скрипт опубликован с закрытым исходным кодом. Однако вы можете использовать его свободно и без каких-либо ограничений — читайте подробнее здесь.
Отказ от ответственности
Информация и публикации не предназначены для предоставления и не являются финансовыми, инвестиционными, торговыми или другими видами советов или рекомендаций, предоставленных или одобренных TradingView. Подробнее читайте в Условиях использования.
Скрипт с защищённым кодом
Этот скрипт опубликован с закрытым исходным кодом. Однако вы можете использовать его свободно и без каких-либо ограничений — читайте подробнее здесь.
Отказ от ответственности
Информация и публикации не предназначены для предоставления и не являются финансовыми, инвестиционными, торговыми или другими видами советов или рекомендаций, предоставленных или одобренных TradingView. Подробнее читайте в Условиях использования.