OPEN-SOURCE SCRIPT
Обновлено [RD] Easy dynamic resolution dashboard
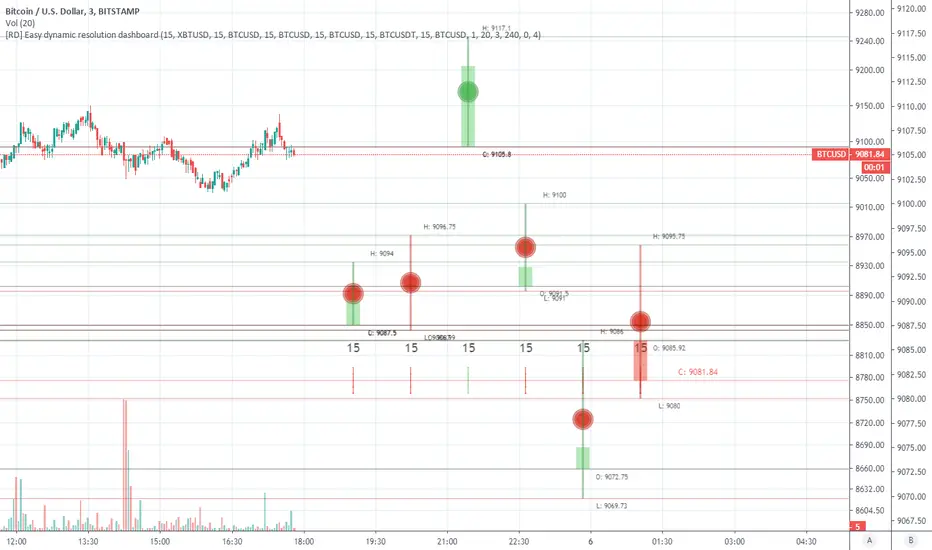
=== Easy dynamic resolution dashboard (initial) ===
Easy dashboard to show different running reolution bars most of the scale is adjustable.
Current state is initial and could have some bugs, or been in a cleaner way of coding. Let me know if you find something so we could fix it
Best way to start is in a seperate pane to adjust the you like best or most. Afterwards can copied to chart if needed
The round circle in the middle is the avg low|high price of that specifick candle in the resolution
Loading and input adjustments could take a while (reload)
You should get a warning if the current timeframe is higher then the input resolutions choosen. Adjust the reolutions according and you should be fine
Special thanks go to and borrowed some code from
- PineCoders
- RicardoSantos
Notes / Updates
- Let me know where it need (bug) fixes or adjustments
Информация о релизе
Notes / Updates- Added possibility to different symbols on each resolution and abbility to make use of the current symbol
- Need some work on the alignment of the labels and text looks weird on different symbols and or tf's, needs to be generic
Информация о релизе
Updated chartUpdate chart screenshot at the scripting section
Информация о релизе
- quick hack to show each resolution on chartИнформация о релизе
Added another chart layoutСкрипт с открытым кодом
В истинном духе TradingView, создатель этого скрипта сделал его открытым исходным кодом, чтобы трейдеры могли проверить и убедиться в его функциональности. Браво автору! Вы можете использовать его бесплатно, но помните, что перепубликация кода подчиняется нашим Правилам поведения.
Отказ от ответственности
Информация и публикации не предназначены для предоставления и не являются финансовыми, инвестиционными, торговыми или другими видами советов или рекомендаций, предоставленных или одобренных TradingView. Подробнее читайте в Условиях использования.
Скрипт с открытым кодом
В истинном духе TradingView, создатель этого скрипта сделал его открытым исходным кодом, чтобы трейдеры могли проверить и убедиться в его функциональности. Браво автору! Вы можете использовать его бесплатно, но помните, что перепубликация кода подчиняется нашим Правилам поведения.
Отказ от ответственности
Информация и публикации не предназначены для предоставления и не являются финансовыми, инвестиционными, торговыми или другими видами советов или рекомендаций, предоставленных или одобренных TradingView. Подробнее читайте в Условиях использования.