OPEN-SOURCE SCRIPT
KINSKI Flexible Volume Oscillator
Обновлено
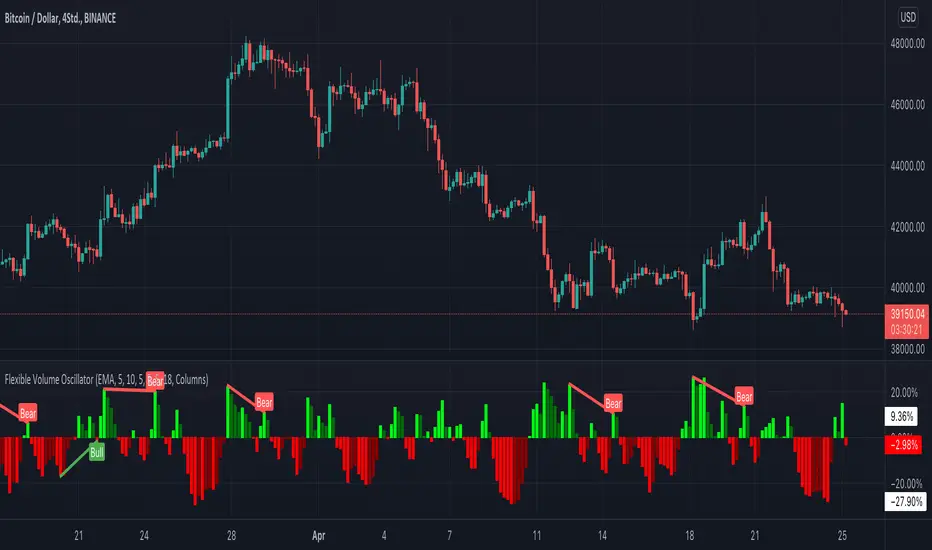
The Volume Oscillator is a trend-oriented indicator that shows the strength or weakness of price trends. This indicator calculates the volume from two moving averages (MA). The value of the slow volume MA is then subtracted from the value of the fast moving average. The Volume Oscillator measures volume by analyzing the relationship between these two moving averages.
The special feature of this indicator is that the type of moving average can be selected as the basis for calculation. Currently, it is possible to choose between the following MA variants:
"COVWMA", "DEMA", "EMA", "EHMA", "FRAMA", "HMA", "KAMA", "RMA", "SMA", "SMMA", "VIDYA", "VWMA", "WMA".
Upward and downward movements are represented in different colors. The following color variants are available:
The colors, as well as the style can be adjusted in the settings according to your own needs.
The special feature of this indicator is that the type of moving average can be selected as the basis for calculation. Currently, it is possible to choose between the following MA variants:
"COVWMA", "DEMA", "EMA", "EHMA", "FRAMA", "HMA", "KAMA", "RMA", "SMA", "SMMA", "VIDYA", "VWMA", "WMA".
Upward and downward movements are represented in different colors. The following color variants are available:
- Color green: Strong upward trend
- Color green/dark: weakening upward trend
- Color red: strong downward trend
- Color red/dark: weakening downward trend
The colors, as well as the style can be adjusted in the settings according to your own needs.
Информация о релизе
- Convert to PineScript5
- add optional Divergence Identification (enabled by default)
Информация о релизе
- add new MA Type => "TEMA" (Triple EMA)
- Refactor some Parts of Script
Информация о релизе
- Simplification of the determination of the MA variant. Instead of separately for long/short period, now one is adjustable for both.
- Fixed Calculating of Variable Index Dynamic Average (VIDYA)
- Refactor Code (type declaration, simplify functions)
Скрипт с открытым кодом
В истинном духе TradingView автор этого скрипта опубликовал его с открытым исходным кодом, чтобы трейдеры могли понять, как он работает, и проверить на практике. Вы можете воспользоваться им бесплатно, но повторное использование этого кода в публикации регулируется Правилами поведения. Вы можете добавить этот скрипт в избранное и использовать его на графике.
Отказ от ответственности
Все виды контента, которые вы можете увидеть на TradingView, не являются финансовыми, инвестиционными, торговыми или любыми другими рекомендациями. Мы не предоставляем советы по покупке и продаже активов. Подробнее — в Условиях использования TradingView.