OPEN-SOURCE SCRIPT
Обновлено 2nd Grade Technique
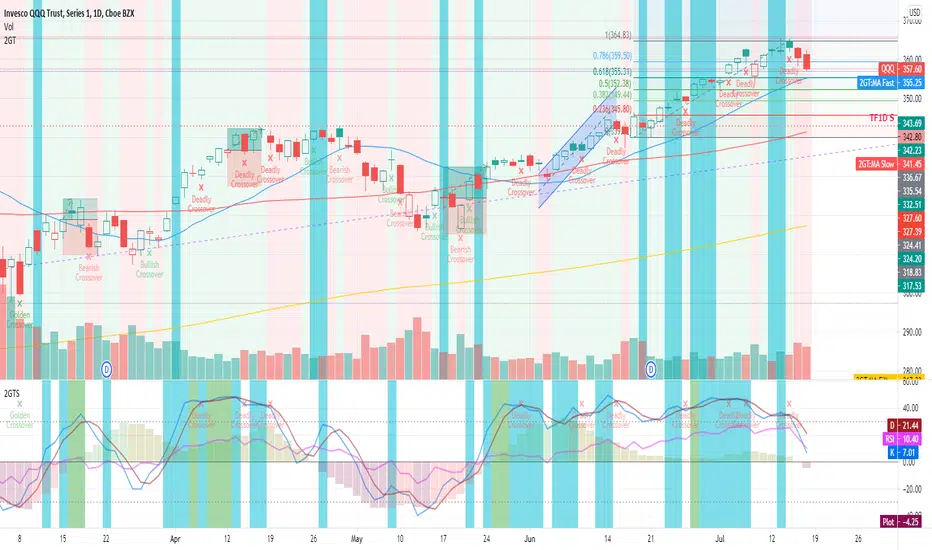
This is comprises of multiple popularly used indicators to help decide on whether to go long or short. This indicator will overlay the MA lines and background colours on your chart.
The heikin-ashi colour will be shown as the background colour. This will help you identify a trend more easily while using bars, candles, hollow candles, etc. When the background is green, it means that it is a green HA and vice versa.
The blue MA line is for showing the short-term trend. The red MA line is for showing the medium-term trend. You can select the moving average flavour of your choice in the settings.
The yellow MA line is the long-term trend that is mainly used as a filter to indicate bullish/bearish trend. The MA type for this filter can be different from the short/mid term MA.
This indicator will also show Stochastic crossovers (GC, DC, BC) on the chart. This will help to always keep your eye on the chart candles.
In the settings, you can also turn on/off bullish/bearish signals.
Rules for bullish signals on this indicator:-
1. MA: Blue > Red > Yellow (FastMA > SlowMA > FilterMA)
2. Stochastic: K > D and both are heading upwards
3. 2nd Green HA
When 2 out of the 3 rules are met, the candle background will be Aqua in colour. When all 3 rules are met, the candle background will be Green.
Rules for bearish signals on this indicator:-
1. MA: Yellow > Red > Blue (FilterMA > SlowMA > FastMA)
2. Stochastic: D > K and both are heading downwards
3. 2nd Red HA
When 2 out of the 3 rules are met, the candle background will be Orange in colour. When all 3 rules are met, the candle background will be Red.
Do note that you can show/hide any of these elements via the settings.
If you find this useful, do smash the LIKE and FOLLOW button.
WSLM
Информация о релизе
Updated bullish and bearish rules.Bullish:-
1. MA: Current candle above FastMA, Blue > Red > Yellow (FastMA > SlowMA > FilterMA) and all are moving upwards
2. Stochastic: K > D and both are heading upwards
3. 2nd Green HA
When 2 out of the 3 rules are met, the candle background will be Aqua in colour. When all 3 rules are met, the candle background will be Green.
Bearish
1. MA: Current candle below FastMA, Yellow > Red > Blue (FilterMA > SlowMA > FastMA) and all are moving downwards
2. Stochastic: D > K and both are heading downwards
3. 2nd Red HA
When 2 out of the 3 rules are met, the candle background will be Orange in colour. When all 3 rules are met, the candle background will be Red.
Скрипт с открытым кодом
В истинном духе TradingView, создатель этого скрипта сделал его открытым исходным кодом, чтобы трейдеры могли проверить и убедиться в его функциональности. Браво автору! Вы можете использовать его бесплатно, но помните, что перепубликация кода подчиняется нашим Правилам поведения.
Отказ от ответственности
Информация и публикации не предназначены для предоставления и не являются финансовыми, инвестиционными, торговыми или другими видами советов или рекомендаций, предоставленных или одобренных TradingView. Подробнее читайте в Условиях использования.