OPEN-SOURCE SCRIPT
Options & Leveraged Shares Heatmap
This is the leveraged share/option heatmap / screener.
Tradingview offers a few different tickers that have PTCR data on the daily timeframe. So I was able to pull those few tickers that display the PTCR data and format it into a heatmap.
I also had some room to add leveraged share data as well.
It is pretty self explanatory but I will go over it really briefly:
The timeframe is 1 D. This cannot be changed because this is the only timeframe available for the PTCR data.
It will pull the current day PTCR as well as the previous day PTCR and display the PTCR and change value.
The screening will be done according to the 1 day change.
You have the ability to select the option to sort by Max and Min or sort by heatmap:

Displaying max and min will show you the max positive and negative change among all the available tickers.
Max positive = bearish, as this indicates an uptick in Puts.
Max negative = bullish, as this indicates a decline in Puts.
If we flip over to the leveraged shares, it is the same:

To keep it consistent, the leveraged share ratio is displayed similar to PTCR. It is Sell to Buy ratio. The higher the ratio, the more selling and vice versa.
Thus, the same rules apply. Max positive = bearish and max negative = bullish.
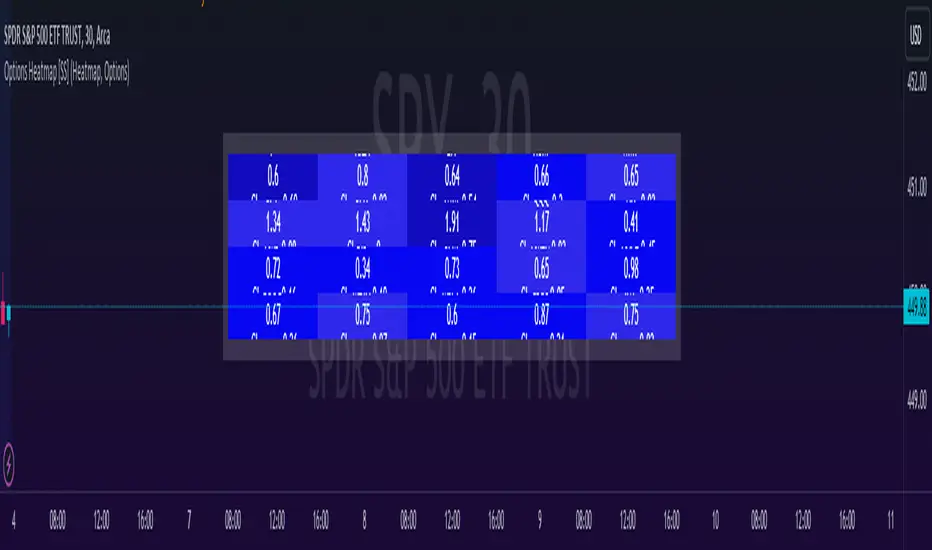
If you want to display the heatmap, this is what it will look like:

The darker the blue, the higher the change in either a negative or positive direction. The same for the leveraged shares:

And that is the indicator.
Hopefully you find it helpful. I like to reference it at the end of each day to see how things are looking in terms of positioning for the following day.
Leave your comments/questions and suggestions below.
Safe trades!
Tradingview offers a few different tickers that have PTCR data on the daily timeframe. So I was able to pull those few tickers that display the PTCR data and format it into a heatmap.
I also had some room to add leveraged share data as well.
It is pretty self explanatory but I will go over it really briefly:
The timeframe is 1 D. This cannot be changed because this is the only timeframe available for the PTCR data.
It will pull the current day PTCR as well as the previous day PTCR and display the PTCR and change value.
The screening will be done according to the 1 day change.
You have the ability to select the option to sort by Max and Min or sort by heatmap:
Displaying max and min will show you the max positive and negative change among all the available tickers.
Max positive = bearish, as this indicates an uptick in Puts.
Max negative = bullish, as this indicates a decline in Puts.
If we flip over to the leveraged shares, it is the same:
To keep it consistent, the leveraged share ratio is displayed similar to PTCR. It is Sell to Buy ratio. The higher the ratio, the more selling and vice versa.
Thus, the same rules apply. Max positive = bearish and max negative = bullish.
If you want to display the heatmap, this is what it will look like:
The darker the blue, the higher the change in either a negative or positive direction. The same for the leveraged shares:
And that is the indicator.
Hopefully you find it helpful. I like to reference it at the end of each day to see how things are looking in terms of positioning for the following day.
Leave your comments/questions and suggestions below.
Safe trades!
Скрипт с открытым кодом
В истинном духе TradingView, создатель этого скрипта сделал его открытым исходным кодом, чтобы трейдеры могли проверить и убедиться в его функциональности. Браво автору! Вы можете использовать его бесплатно, но помните, что перепубликация кода подчиняется нашим Правилам поведения.
Get:
- Live Updates,
- Discord access,
- Access to my Proprietary Merlin Software,
- Access to premium indicators,
patreon.com/steversteves
Now on X!
- Live Updates,
- Discord access,
- Access to my Proprietary Merlin Software,
- Access to premium indicators,
patreon.com/steversteves
Now on X!
Отказ от ответственности
Информация и публикации не предназначены для предоставления и не являются финансовыми, инвестиционными, торговыми или другими видами советов или рекомендаций, предоставленных или одобренных TradingView. Подробнее читайте в Условиях использования.