OPEN-SOURCE SCRIPT
Equal Highs and Equal Lows

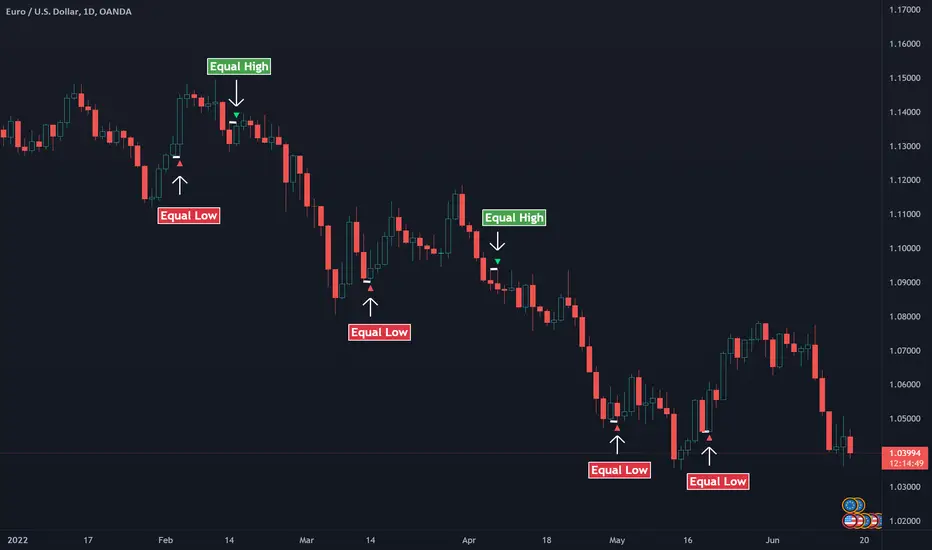
A simple indicator that detects if two candles lows or highs are equal. The pattern simply indicates the possibility of a reversal. However, many traders also use the Equal highs/lows within a broader context of market analysis to provide insights for trend traders, especially to detect pullbacks.
Equal Highs/Lows are a pattern that can indicate a shift in a trend direction or to find pullbacks within an established trend. The idea behind the equal highs and lows is that the first candle shows a strong move in the current direction, and the second candle pauses the previous candlestick price action. It's a clear sign that the momentum is slowing down. This insight is valuable for traders and can detect a potential change in the trend direction.
Usage
Disclaimer: No financial advice, only for educational/entertainment purposes.
Equal Highs/Lows are a pattern that can indicate a shift in a trend direction or to find pullbacks within an established trend. The idea behind the equal highs and lows is that the first candle shows a strong move in the current direction, and the second candle pauses the previous candlestick price action. It's a clear sign that the momentum is slowing down. This insight is valuable for traders and can detect a potential change in the trend direction.
Usage
- Use the pattern to find reversals.
- Use the pattern to find pullbacks.
Disclaimer: No financial advice, only for educational/entertainment purposes.
Скрипт с открытым кодом
В истинном духе TradingView, создатель этого скрипта сделал его открытым исходным кодом, чтобы трейдеры могли проверить и убедиться в его функциональности. Браво автору! Вы можете использовать его бесплатно, но помните, что перепубликация кода подчиняется нашим Правилам поведения.
Отказ от ответственности
Информация и публикации не предназначены для предоставления и не являются финансовыми, инвестиционными, торговыми или другими видами советов или рекомендаций, предоставленных или одобренных TradingView. Подробнее читайте в Условиях использования.