OPEN-SOURCE SCRIPT
Обновлено Banana RSI
Banana RSI is not just ap-PEAL-ing to the eyes!
This simple little indicator provides a New Approach to determining Overbought and Oversold levels, as well as taking advantage of a non-typical smoothing method for this type of indicator.
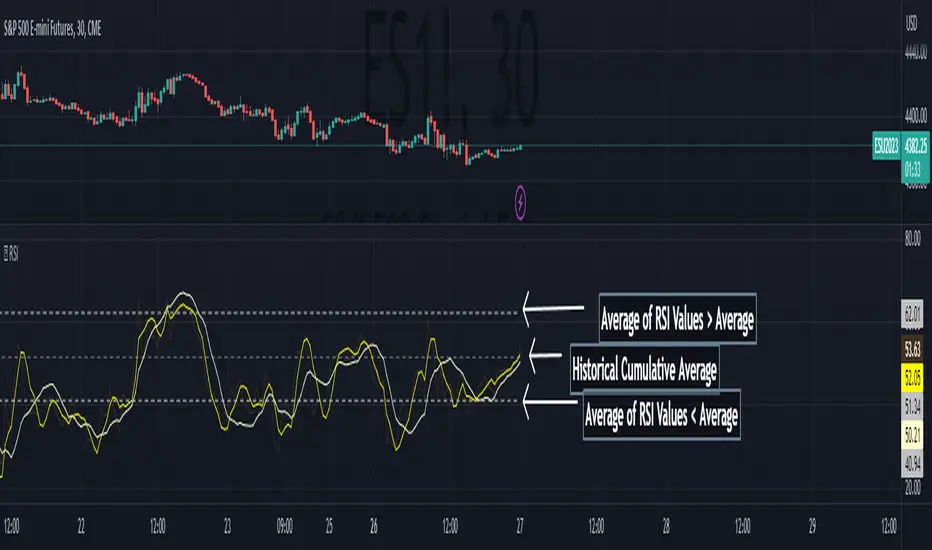
Banana RSI uses a Cumulative High and Low Average to draw the upper, lower, and midline.
The High and Low Averages use the data only from above or below the Cumulative Average to calculate their respective line.
In simpler terms:
This creates an automated method to determine overbought and oversold territory based on the charts historical movement.
Since every chart can be different, these levels change with the chart.
Banana RSI also uses a linear regression smoothing method, by taking advantage of the built-in Least Squares Moving Average, we are able to view a better reacting/less-lagging moving average.
Included are 2 Length-Adjustable LSMA lines to use however needed.
Using the Regression Lines along with the High & Low Averages provides a new view on the classic RSI indicator.
Enjoy!
This simple little indicator provides a New Approach to determining Overbought and Oversold levels, as well as taking advantage of a non-typical smoothing method for this type of indicator.
Banana RSI uses a Cumulative High and Low Average to draw the upper, lower, and midline.
The High and Low Averages use the data only from above or below the Cumulative Average to calculate their respective line.
In simpler terms:
- The High average is an average of every value ABOVE the full average.
- The Low average is an average of every value BELOW the full average.
This creates an automated method to determine overbought and oversold territory based on the charts historical movement.
Since every chart can be different, these levels change with the chart.
Banana RSI also uses a linear regression smoothing method, by taking advantage of the built-in Least Squares Moving Average, we are able to view a better reacting/less-lagging moving average.
Included are 2 Length-Adjustable LSMA lines to use however needed.
Using the Regression Lines along with the High & Low Averages provides a new view on the classic RSI indicator.
Enjoy!
Информация о релизе
formatting errorСкрипт с открытым кодом
В истинном духе TradingView, создатель этого скрипта сделал его открытым исходным кодом, чтобы трейдеры могли проверить и убедиться в его функциональности. Браво автору! Вы можете использовать его бесплатно, но помните, что перепубликация кода подчиняется нашим Правилам поведения.
Custom PineScript Development:
reciodev.com
Paid Indicators:
tradingview.com/spaces/SamRecio/
reciodev.com
Paid Indicators:
tradingview.com/spaces/SamRecio/
Отказ от ответственности
Информация и публикации не предназначены для предоставления и не являются финансовыми, инвестиционными, торговыми или другими видами советов или рекомендаций, предоставленных или одобренных TradingView. Подробнее читайте в Условиях использования.
Скрипт с открытым кодом
В истинном духе TradingView, создатель этого скрипта сделал его открытым исходным кодом, чтобы трейдеры могли проверить и убедиться в его функциональности. Браво автору! Вы можете использовать его бесплатно, но помните, что перепубликация кода подчиняется нашим Правилам поведения.
Custom PineScript Development:
reciodev.com
Paid Indicators:
tradingview.com/spaces/SamRecio/
reciodev.com
Paid Indicators:
tradingview.com/spaces/SamRecio/
Отказ от ответственности
Информация и публикации не предназначены для предоставления и не являются финансовыми, инвестиционными, торговыми или другими видами советов или рекомендаций, предоставленных или одобренных TradingView. Подробнее читайте в Условиях использования.