OPEN-SOURCE SCRIPT
Stoch_RSI
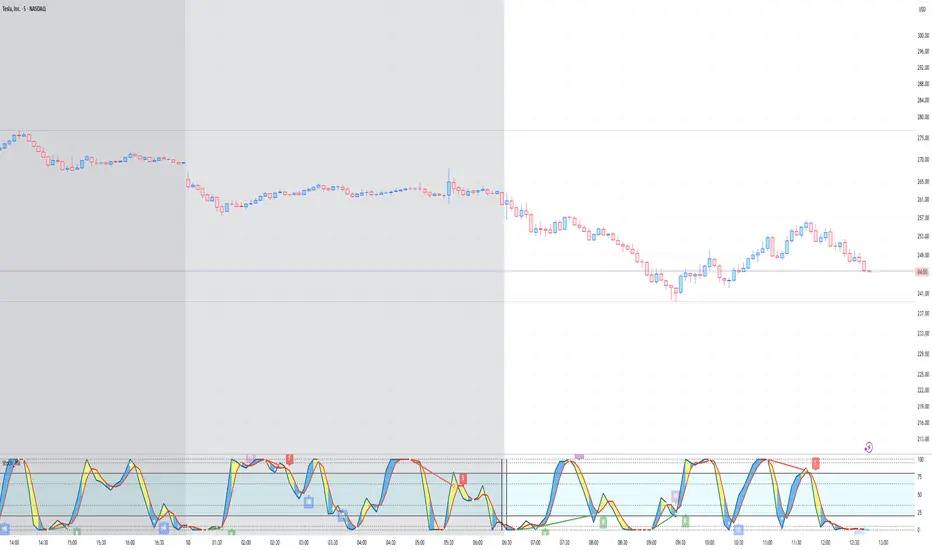
Stochastic RSI – Advanced Divergence Indicator
This custom indicator is an advanced version of the Stochastic RSI that not only smooths and refines the classic RSI input but also automatically detects both regular and hidden divergences using two powerful methods: fractal-based and pivot-based detection. Originally inspired by contributions from fskrypt, RicardoSantos, and later improved by developers like NeoButane and fymd, this script has been fully refined for clarity and ease-of-use.
Key Features:
Dual Divergence Detection:
Fractal-Based Divergence: Uses a four-candle pattern to confirm top and bottom fractals for bullish and bearish divergences.
Pivot-Based Divergence: Employs TradingView’s built-in pivot functions for an alternate view of divergence conditions.
Customizable Settings:
The inputs are organized into logical groups (Stoch RSI settings, Divergence Options, Labels, and Market Open Settings) allowing you to adjust smoothing periods, RSI and Stochastic lengths, and divergence thresholds with a user-friendly interface.
Visual Enhancements:
Plots & Fills: The indicator plots both the K and D lines with corresponding fills and horizontal bands for quick visual reference.
Divergence Markers: Diamond shapes and labeled markers indicate regular and hidden divergences on the chart.
Market Open Highlighting: Optional histogram plots highlight the market open candle based on different timeframes for stocks versus non-forex symbols.
Скрипт с открытым кодом
В истинном духе TradingView, создатель этого скрипта сделал его открытым исходным кодом, чтобы трейдеры могли проверить и убедиться в его функциональности. Браво автору! Вы можете использовать его бесплатно, но помните, что перепубликация кода подчиняется нашим Правилам поведения.
Отказ от ответственности
Информация и публикации не предназначены для предоставления и не являются финансовыми, инвестиционными, торговыми или другими видами советов или рекомендаций, предоставленных или одобренных TradingView. Подробнее читайте в Условиях использования.