OPEN-SOURCE SCRIPT
Обновлено EMA Multi Cross
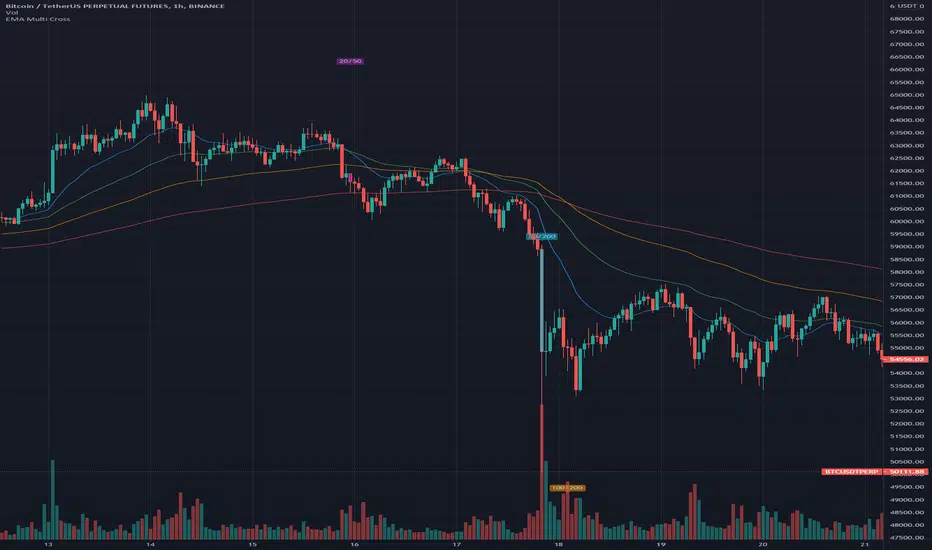
This is just a very simple EMA indicator that shows the 20, 50, 100, and 200 Exponential Moving Averages and plots some shapes when the lines cross from the 20 & 50, the 50 & 200, and the 100 & 200.
I know there are many EMA indicators out there, but I couldn't find one that let me edit the colors, values, and toggle the crossings. Maybe some of you will find usefulness in having some of these extra options too.
I use this occasionally on the Bitcoin 1 hour charts to see how the long-term trend is going.
Here are some ways to read EMA lines:
Slope: A rising moving average generally reflects a rising trend, while a falling moving average points to a falling trend.
Crosses: Seeing when a slower moving average crosses over/under a faster moving average can be an indication of a trend. If a shorter moving average remains above the longer moving average after they cross, the uptrend is considered intact. The trend is seen as down when the shorter moving average is below the longer moving average.
I prefer the slope of the two since crosses can cause some false positives if you are relying on it for trades.
Информация о релизе
Added bar coloring as requested.20 crossing with 50 shows a purple candle.
50 crossing with 200 shows an aqua candle.
100 crossing with 200 shows an orange candle.
Скрипт с открытым кодом
В истинном духе TradingView, создатель этого скрипта сделал его открытым исходным кодом, чтобы трейдеры могли проверить и убедиться в его функциональности. Браво автору! Вы можете использовать его бесплатно, но помните, что перепубликация кода подчиняется нашим Правилам поведения.
Отказ от ответственности
Информация и публикации не предназначены для предоставления и не являются финансовыми, инвестиционными, торговыми или другими видами советов или рекомендаций, предоставленных или одобренных TradingView. Подробнее читайте в Условиях использования.