OPEN-SOURCE SCRIPT
NASDAQ Trading System with Pivots
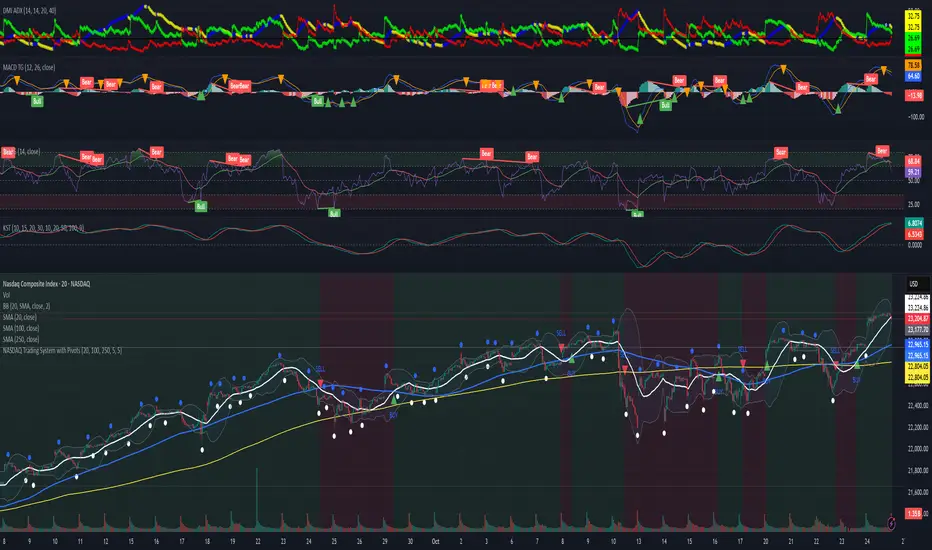
This TradingView indicator, designed for the 30-minute NASDAQ (^IXIC) chart, guides QQQ options trading using a trend-following strategy. It plots a 20-period SMA (blue) and a 100-period SMA (red), with an optional 250-period SMA (orange) inspired by rauItrades' NASDAQ SMA outfit. A bullish crossover (20 SMA > 100 SMA) triggers a green "BUY" triangle below the bar, signaling a potential long position in QQQ, while a bearish crossunder (20 SMA < 100 SMA) shows a red "SELL" triangle above, indicating a short or exit. The background colors green (bullish) or red (bearish) for trend bias. Orange circles (recent highs) and purple circles (recent lows) mark support/resistance levels using 5-bar pivot points.
Скрипт с открытым кодом
В истинном духе TradingView, создатель этого скрипта сделал его открытым исходным кодом, чтобы трейдеры могли проверить и убедиться в его функциональности. Браво автору! Вы можете использовать его бесплатно, но помните, что перепубликация кода подчиняется нашим Правилам поведения.
Отказ от ответственности
Информация и публикации не предназначены для предоставления и не являются финансовыми, инвестиционными, торговыми или другими видами советов или рекомендаций, предоставленных или одобренных TradingView. Подробнее читайте в Условиях использования.