OPEN-SOURCE SCRIPT
Range + Breakout/Breakdown + Box [Sharad] v5
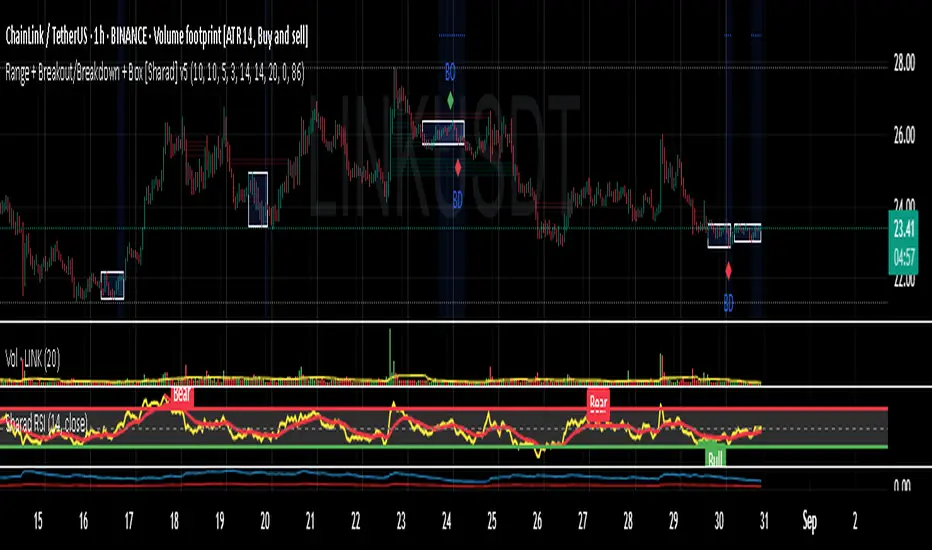
🔷 Range + Breakout/Breakdown + Box [Sharad]
This indicator is designed to detect consolidation ranges and highlight potential breakouts (up) or breakdowns (down) when price escapes those ranges.
It automatically draws a rectangle box over the detected range, making it easier to visualize sideways price action and potential coil patterns.
✨ Features
Detects range conditions based on:
Range width (as % of price and/or relative to ATR).
Consecutive bar count inside range.
Optional ADX filter for trend strength.
Highlights Breakout Up and Breakdown Down with on-chart markers.
Draws a box around the range that persists until the range ends.
Built-in TradingView alerts:
Range Detected
Breakout Up
Breakdown Down
Customizable inputs for sensitivity, buffer, and visualization.
⚠️ Warnings & Disclaimer
This tool is for educational and research purposes only.
It does NOT provide financial advice, trade recommendations, or guaranteed results.
Market conditions can invalidate signals; false breakouts are common.
Always backtest before using in live trading.
Use strict risk management (stop-loss, position sizing, risk–reward planning).
You are fully responsible for any trades taken using this indicator.
👉 Use at your own risk. Neither the author nor TradingView accepts liability for financial loss or damages.
Скрипт с открытым кодом
В истинном духе TradingView автор этого скрипта опубликовал его с открытым исходным кодом, чтобы трейдеры могли понять, как он работает, и проверить на практике. Вы можете воспользоваться им бесплатно, но повторное использование этого кода в публикации регулируется Правилами поведения.
Отказ от ответственности
Все виды контента, которые вы можете увидеть на TradingView, не являются финансовыми, инвестиционными, торговыми или любыми другими рекомендациями. Мы не предоставляем советы по покупке и продаже активов. Подробнее — в Условиях использования TradingView.