DinhChienFX Elliot targets 1.1
I present my new Elliot targets script.
Anyone learning the Elliot wave is very difficult and difficult to understand.
I would like to take a few parts of the Elliot wave theory that is how to calculate the retracement area
and price levels according to the Fibonacci ratio of the Elliot wave. A Then combine the basic indicators Bollinger Band, MACD-H and RSI
to predict the future of the market. And try to automate the above.
The idea in the Elliot targets scenario is to combine:
+ Oscillators indicator (Rsi - Relative Strength Index)
+ Center Oscillators indicator (MACD - Moving Average convergence Divergence)
+ Volatility indicator (BB - Bollinger Band).
There are some option in the script, let see:
- Bollinger Band: calculates trend with signal combination from Bollinger Band indicator.
- RSI: calculates trend with signal combination from RSI.
- MACD: Main indicator of Elliot targets script, with option Histogram highest or lowest
in a week, a month, quarter, year depending on timeframe H1, H4 or Daily... I will show with pictures following photo.
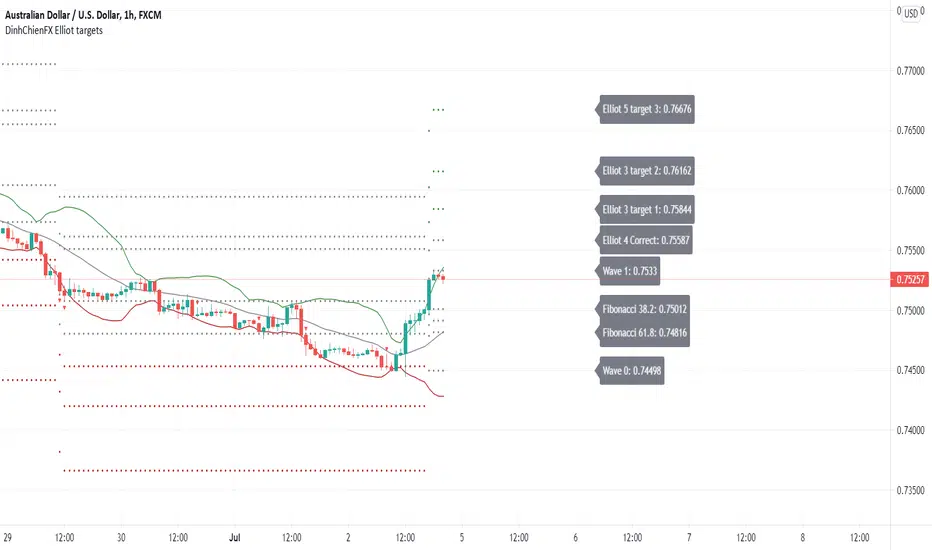
- Label: Option to display the price notice board:
1 - Main bulletins board (default: off): showing all prices at Fibonacci levels (38.2, 50, 61.8, 161.8, 200, 261.8).
2 - Separate bulletin board for 2 trends (up - down): current price at Fibonacci levels (38.2, 50, 61.8, 161.8, 200, 261.8).
- Generate Alerts: 1. Uptrend triggered. 2. Downtrend activated.
Here are a few examples of how the editor uses the above indicators to predict goals:
- The signal is with only MACD:
- The signals combine MACD and Bollinger Band:
- The signals combine MACD and RSI:
- The signals combine MACD + Bollinger band + RSI:
* The label shows:
- Main label is at Uptrend:
- Main label is at Downtrend:
- The separate labels is at Uptrend:
- The separate labels is at Downtrend:
Скрипт с ограниченным доступом
Только пользователи, одобренные автором, могут получить доступ к этому скрипту. Вам нужно отправить запрос и получить разрешение на его использование. Обычно доступ предоставляется после оплаты. Для получения подробной информации следуйте инструкциям автора ниже или свяжитесь с dinhchien напрямую.
TradingView НЕ рекомендует платить за скрипт или использовать его, если вы не доверяете его автору и не понимаете, как скрипт работает. Вы всегда можете найти бесплатные скрипты с открытым исходным кодом в Скриптах сообщества.
Инструкции от автора
Отказ от ответственности
Скрипт с ограниченным доступом
Только пользователи, одобренные автором, могут получить доступ к этому скрипту. Вам нужно отправить запрос и получить разрешение на его использование. Обычно доступ предоставляется после оплаты. Для получения подробной информации следуйте инструкциям автора ниже или свяжитесь с dinhchien напрямую.
TradingView НЕ рекомендует платить за скрипт или использовать его, если вы не доверяете его автору и не понимаете, как скрипт работает. Вы всегда можете найти бесплатные скрипты с открытым исходным кодом в Скриптах сообщества.