PROTECTED SOURCE SCRIPT
Quartile Dots — SharkCIA

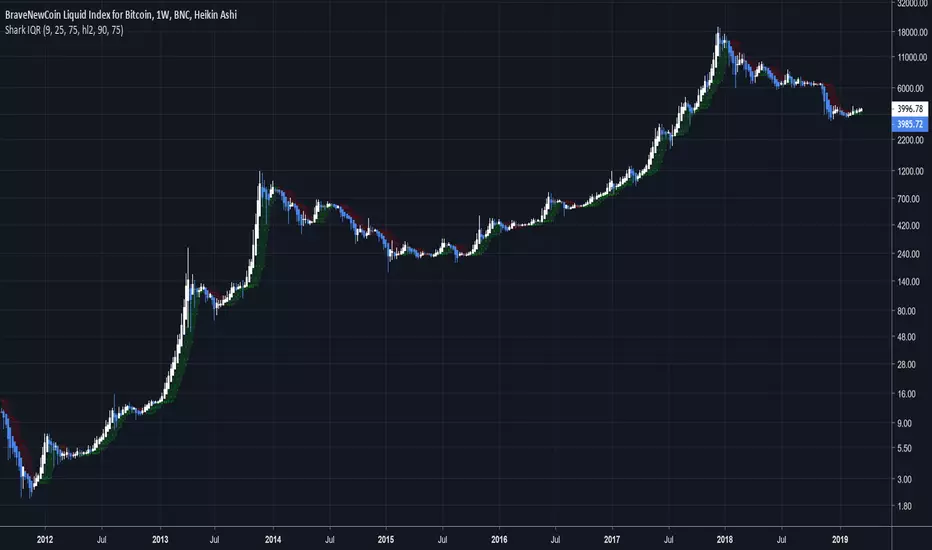
Trend detection for any timeframe.
In statistics, the interquartile range, also called the midspread or middle 50%, is a measure of statistical dispersion, being equal to the difference between 75th and 25th percentiles, or between upper and lower quartiles.
This script works identical to Interquartile Range, but instead of lines on the median and upper/lower quartiles, we're drawing circles instead.

Отказ от ответственности
Все виды контента, которые вы можете увидеть на TradingView, не являются финансовыми, инвестиционными, торговыми или любыми другими рекомендациями. Мы не предоставляем советы по покупке и продаже активов. Подробнее — в Условиях использования TradingView.