OPEN-SOURCE SCRIPT
Highs and Lows Marker
Indicator Description – Highs and Lows Marker
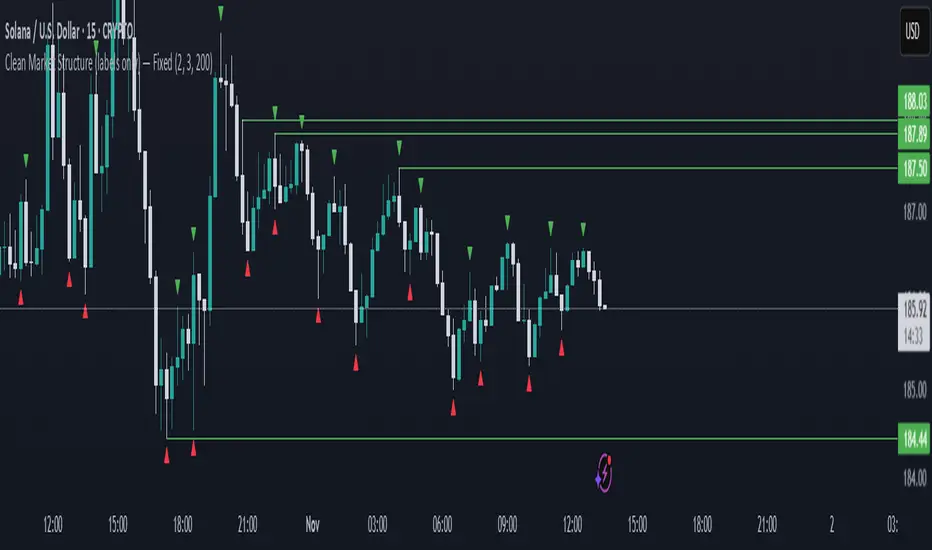
This indicator identifies swing highs and swing lows based on a simple two-candle pattern structure:
High Formation (Swing High):
A High is marked when a bullish candle (Candle Up) is immediately followed by a bearish candle (Candle Down).
The High value is taken as the highest wick price between the two candles in this formation.
This represents a potential short-term resistance or turning point in the market.
Low Formation (Swing Low):
A Low is marked when a bearish candle (Candle Down) is immediately followed by a bullish candle (Candle Up).
The Low value is taken as the lowest wick price between the two candles in this formation.
This represents a potential short-term support or reversal area.
Скрипт с открытым кодом
В истинном духе TradingView, создатель этого скрипта сделал его открытым исходным кодом, чтобы трейдеры могли проверить и убедиться в его функциональности. Браво автору! Вы можете использовать его бесплатно, но помните, что перепубликация кода подчиняется нашим Правилам поведения.
Отказ от ответственности
Информация и публикации не предназначены для предоставления и не являются финансовыми, инвестиционными, торговыми или другими видами советов или рекомендаций, предоставленных или одобренных TradingView. Подробнее читайте в Условиях использования.