OPEN-SOURCE SCRIPT
Обновлено Force Index with Buy on Dip strategy
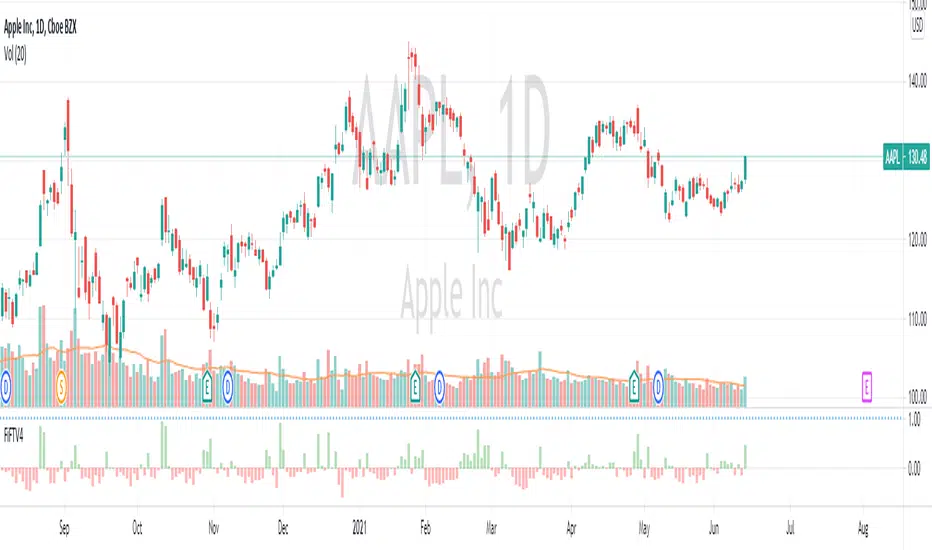
This charts has 2 indicators
1 - Force Index
This indicator is based on Dr Alexander Elder ForceIndex indicator with relate price to volume by multiplying net change and volume.
- GREEN Bar indicates Bull is in control
- RED Bar indicates Bear is in control.
LENGTH of the bar indicate the strength of Bull or Bear.
Normally there's potential BUY if the RED bar turned GREEN and SELL if GREEN to RED.
2 - Stochastic momentum
Stochastic momentum is to detect potential Reversal where BLUE bar will appear if :-
- Oversold - Stochastic less than 35
- Closing price is higher than last 2 High (Fast Turtle)
// Note : Best use with "EMA Indicators with BUY sell Signal"
Информация о релизе
*****************************************************************************************Description :-
This indicator is based on Dr Alexander Elder ForceIndex indicator
with relate price to volume by multiplying net change and volume.
1 - GREEN Bar and GREEN background indicates Bull is in control
2 - RED Bar and RED background indicates Bear is in control.
LENGTH of the bar indicate the strength of Bull or Bear.
Normally there's potential BUY if the RED bar turned GREEN and SELL if GREEN to RED.
On top of that, it's also include information about Stochastic momentum to detect
potential Reversal. BLUE bar will appear if :-
1 - Oversold - Stochastic less than 35 (Default value set at 35)
2 - Closing price is higher than last 2 High
Note : Best use with "EMA Indicators with BUY sell Signal"
Информация о релизе
New Update :-Change background color of the FiFT indicator to indicate BULL or BEAR force.
1 - GREEN Bar and GREEN background indicates Bull is in control
2 - RED Bar and RED background indicates Bear is in control.
LENGTH of the bar indicate the strength of Bull or Bear.
Normally there's potential BUY if the RED bar turned GREEN and SELL if GREEN to RED.
On top of that, it's also include information about Stochastic momentum to detect
potential Reversal. BLUE bar will appear if :-
1 - Oversold - Stochastic less than 35 (Default value set at 35)
2 - Closing price is higher than last 2 High
Note : Best use with "EMA Indicators with BUY sell Signal"
Информация о релизе
Remove Star from -ve FiFT BOD signal. Информация о релизе
Bug fix : FiFT change with different candle type.Standardize signal to avoid confusion : OB = Overbought, OS = Oversold.
Информация о релизе
Code Clean upИнформация о релизе
Simplify the code to focus on volume only instead of integrating Volume and PirceСкрипт с открытым кодом
В истинном духе TradingView, создатель этого скрипта сделал его открытым исходным кодом, чтобы трейдеры могли проверить и убедиться в его функциональности. Браво автору! Вы можете использовать его бесплатно, но помните, что перепубликация кода подчиняется нашим Правилам поведения.
Contact me to learn Turtle Trading System, MCDX and other indicators (t.me/SgxFx)
tradingview.com/script/mbiUr95n-MCDX-Plus/
tradingview.com/script/mcAidXIT-FiFT-Pro/
tradingview.com/script/viAR3Ilo-Trend-Sign
tradingview.com/script/mbiUr95n-MCDX-Plus/
tradingview.com/script/mcAidXIT-FiFT-Pro/
tradingview.com/script/viAR3Ilo-Trend-Sign
Отказ от ответственности
Информация и публикации не предназначены для предоставления и не являются финансовыми, инвестиционными, торговыми или другими видами советов или рекомендаций, предоставленных или одобренных TradingView. Подробнее читайте в Условиях использования.
Скрипт с открытым кодом
В истинном духе TradingView, создатель этого скрипта сделал его открытым исходным кодом, чтобы трейдеры могли проверить и убедиться в его функциональности. Браво автору! Вы можете использовать его бесплатно, но помните, что перепубликация кода подчиняется нашим Правилам поведения.
Contact me to learn Turtle Trading System, MCDX and other indicators (t.me/SgxFx)
tradingview.com/script/mbiUr95n-MCDX-Plus/
tradingview.com/script/mcAidXIT-FiFT-Pro/
tradingview.com/script/viAR3Ilo-Trend-Sign
tradingview.com/script/mbiUr95n-MCDX-Plus/
tradingview.com/script/mcAidXIT-FiFT-Pro/
tradingview.com/script/viAR3Ilo-Trend-Sign
Отказ от ответственности
Информация и публикации не предназначены для предоставления и не являются финансовыми, инвестиционными, торговыми или другими видами советов или рекомендаций, предоставленных или одобренных TradingView. Подробнее читайте в Условиях использования.