PROTECTED SOURCE SCRIPT
Probability of Monday Rise After Friday Fall

Purpose:
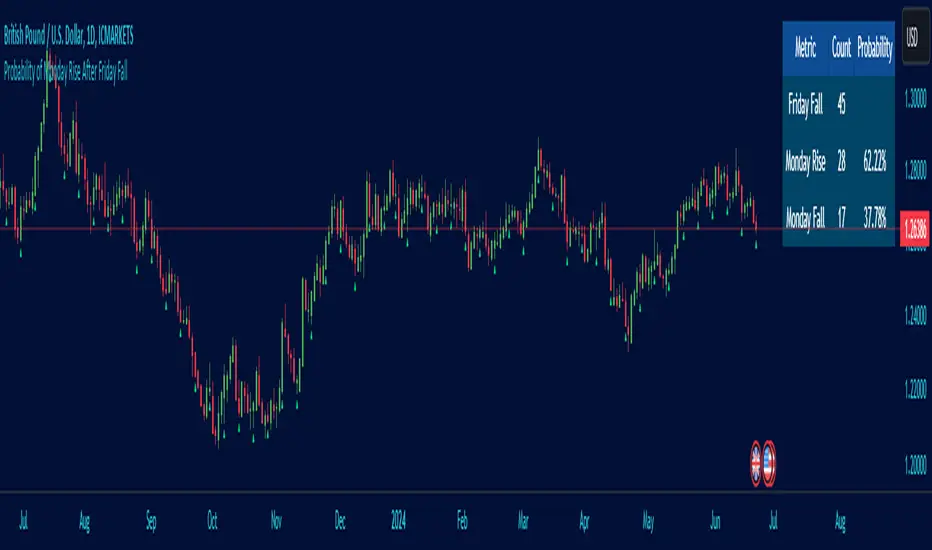
This indicator calculates the probability of a price rise on Monday following a fall on the preceding Friday. It marks Fridays on the chart and displays the count and probabilities of such occurrences over the last 500 bars (or a user-defined lookback period).
Inputs:
Lookback Period: The number of bars to look back for the analysis (default is 500).
Mark Fridays?: Option to mark Fridays on the chart.
Table Background Color: The background color of the results table.
Text Color: The color of the text in the results table.
Logic:
Initialization:
The script initializes counters for:
Fridays with a fall (bear bars).
Mondays with a rise (bull bars) following a Friday fall.
Mondays with a fall (bear bars) following a Friday fall.
Definitions:
isFriday(): Checks if a bar is a Friday.
isMonday(): Checks if a bar is a Monday.
Data Analysis:
The script iterates over the last 500 bars (or the user-defined lookback period) to:
Identify Fridays with a fall (bear bars).
Check the next bar to see if it is a Monday and if it follows a Friday fall. If so, it checks whether the Monday is a rise (bull bar) or a fall (bear bar) and increments the corresponding counter.
Calculating Probabilities:
Probability of Monday Rise after Friday Fall: The ratio of Mondays with a rise following a Friday fall to the total number of Friday falls, expressed as a percentage.
Probability of Monday Fall after Friday Fall: The ratio of Mondays with a fall following a Friday fall to the total number of Friday falls, expressed as a percentage.
Displaying Results:
The results are displayed in a table at the top right corner of the chart, showing:
The count of Fridays with a fall.
The count and probability of Mondays with a rise following a Friday fall.
The count and probability of Mondays with a fall following a Friday fall.
Marking Fridays:
Optionally, the script marks Fridays on the chart with a triangle below the bar.
Скрипт с защищённым кодом
Этот скрипт опубликован с закрытым исходным кодом. Однако вы можете использовать его свободно и без каких-либо ограничений — читайте подробнее здесь.
Отказ от ответственности
Информация и публикации не предназначены для предоставления и не являются финансовыми, инвестиционными, торговыми или другими видами советов или рекомендаций, предоставленных или одобренных TradingView. Подробнее читайте в Условиях использования.