OPEN-SOURCE SCRIPT
Value at Risk [OmegaTools]
The "Value at Risk" (VaR) indicator is a powerful financial risk management tool that helps traders estimate the potential losses in a portfolio over a specified period of time, given a certain level of confidence. VaR is widely used by financial institutions, traders, and risk managers to assess the probability of portfolio losses in both normal and volatile market conditions. This TradingView script implements a comprehensive VaR calculation using several models, allowing users to visualize different risk scenarios and adjust their trading strategies accordingly.
Concept of Value at Risk
Value at Risk (VaR) is a statistical technique used to measure the likelihood of losses in a portfolio or financial asset due to market risks. In essence, it answers the question: "What is the maximum potential loss that could occur in a given portfolio over a specific time horizon, with a certain confidence level?" For instance, if a portfolio has a one-day 95% VaR of $10,000, it means that there is a 95% chance the portfolio will not lose more than $10,000 in a single day. Conversely, there is a 5% chance of losing more than $10,000. VaR is a key risk management tool for portfolio managers and traders because it quantifies potential losses in monetary terms, allowing for better-informed decision-making.
There are several ways to calculate VaR, and this indicator script incorporates three of the most commonly used models:
Historical VaR: This approach uses historical returns to estimate potential losses. It is based purely on past price data, assuming that the past distribution of returns is indicative of future risks.
Variance-Covariance VaR: This model assumes that asset returns follow a normal distribution and that the risk can be summarized using the mean and standard deviation of past returns. It is a parametric method that is widely used in financial risk management.
Exponentially Weighted Moving Average (EWMA) VaR: In this model, recent data points are given more weight than older data. This dynamic approach allows the VaR estimation to react more quickly to changes in market volatility, which is particularly useful during periods of market stress. This model uses the Exponential Weighted Moving Average Volatility Model.
How the Script Works
The script starts by offering users a set of customizable input settings. The first input allows the user to choose between two main calculation modes: "All" or "OCT" (Only Current Timeframe). In the "All" mode, the script calculates VaR using all available methodologies—Historical, Variance-Covariance, and EWMA—providing a comprehensive risk overview. The "OCT" mode narrows the calculation to the current timeframe, which can be particularly useful for intraday traders who need a more focused view of risk.
The next input is the lookback window, which defines the number of historical periods used to calculate VaR. Commonly used lookback periods include 21 days (approximately one month), 63 days (about three months), and 252 days (roughly one year), with the script supporting up to 504 days for more extended historical analysis. A longer lookback period provides a more comprehensive picture of risk but may be less responsive to recent market conditions.
The confidence level is another important setting in the script. This represents the probability that the loss will not exceed the VaR estimate. Standard confidence levels are 90%, 95%, and 99%. A higher confidence level results in a more conservative risk estimate, meaning that the calculated VaR will reflect a more extreme loss scenario.
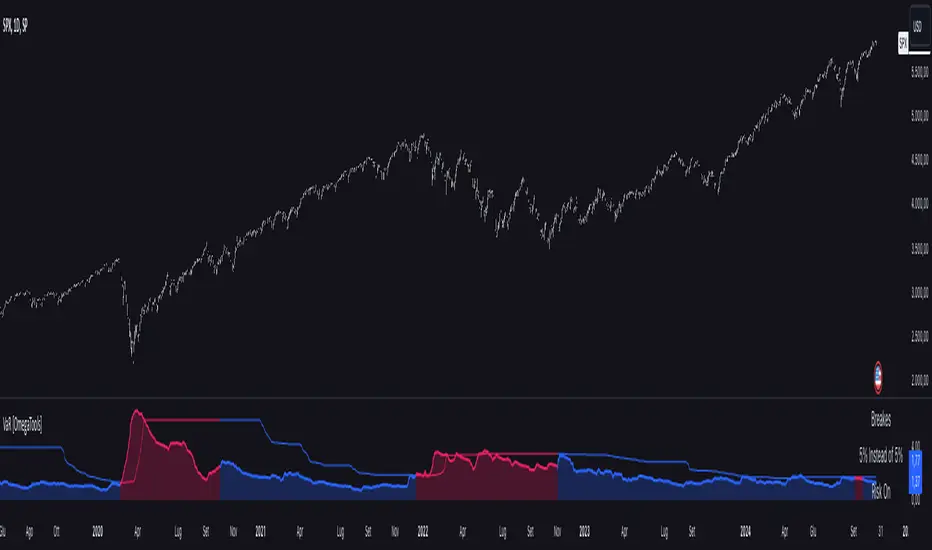
In addition to these core settings, the script allows users to customize the visual appearance of the indicator. For example, traders can choose different colors for "Bullish" (Risk On), "Bearish" (Risk Off), and "Neutral" phases, as well as colors for highlighting "Breaks" in the data, where returns exceed the calculated VaR. These visual cues make it easy to identify periods of heightened risk at a glance.
The actual VaR calculation is broken down into several models, starting with the Historical VaR calculation. This is done by computing the logarithmic returns of the asset's closing prices and then using linear interpolation to determine the percentile corresponding to the desired confidence level. This percentile represents the potential loss in the asset over the lookback period.
Next, the script calculates Variance-Covariance VaR using the mean and standard deviation of the historical returns. The standard deviation is multiplied by a z-score corresponding to the chosen confidence level (e.g., 1.645 for 95% confidence), and the resulting value is subtracted from the mean return to arrive at the VaR estimate.
The EWMA VaR model uses the EWMA for the sigma parameter, the standard deviation, obtaining a specific dynamic in the volatility. It is particularly useful in volatile markets where recent price behavior is more indicative of future risk than older data.
For traders interested in intraday risk management, the script provides several methods to adjust VaR calculations for lower timeframes. By using intraday returns and scaling them according to the chosen timeframe, the script provides a dynamic view of risk throughout the trading day. This is especially important for short-term traders who need to manage their exposure during high-volatility periods within the same day. The script also incorporates an EWMA model for intraday data, which gives greater weight to the most recent intraday price movements.
In addition to calculating VaR, the script also attempts to detect periods where the asset's returns exceed the estimated VaR threshold, referred to as "Breaks." When the returns breach the VaR limit, the script highlights these instances on the chart, allowing traders to quickly identify periods of extreme risk. The script also calculates the average of these breaks and displays it for comparison, helping traders understand how frequently these high-risk periods occur.
The script further visualizes the risk scenario using a risk phase classification system. Depending on the level of risk, the script categorizes the market as either "Risk On," "Risk Off," or "Risk Neutral." In "Risk On" mode, the market is considered bullish, and the indicator displays a green background. In "Risk Off" mode, the market is bearish, and the background turns red. If the market is neither strongly bullish nor bearish, the background turns neutral, signaling a balanced risk environment.
Traders can customize whether they want to see this risk phase background, along with toggling the display of the various VaR models, the intraday methods, and the break signals. This flexibility allows traders to tailor the indicator to their specific needs, whether they are day traders looking for quick intraday insights or longer-term investors focused on historical risk analysis.
The "Risk On" and "Risk Off" phases calculated by this Value at Risk (VaR) script introduce a novel approach to market risk assessment, offering traders an advanced toolset to gauge market sentiment and potential risk levels dynamically. These risk phases are built on a combination of traditional VaR methodologies and proprietary logic to create a more responsive and intuitive way to manage exposure in both normal and volatile market conditions. This method of classifying market conditions into "Risk On," "Risk Off," or "Risk Neutral" is not something that has been traditionally associated with VaR, making it a groundbreaking addition to this indicator.
How the "Risk On" and "Risk Off" Phases Are Calculated
In typical VaR implementations, the focus is on calculating the potential losses at a given confidence level without providing an overall market outlook. This script, however, introduces a unique risk classification system that takes the output of various VaR models and translates it into actionable signals for traders, marking whether the market is in a Risk On, Risk Off, or Risk Neutral phase.
The Risk On and Risk Off phases are primarily determined by comparing the current returns of the asset to the average VaR calculated across several different methods, including Historical VaR, Variance-Covariance VaR, and EWMA VaR. Here's how the process works:
1. Threshold Setting and Effect Calculation: The script first computes the average VaR using the selected models. It then checks whether the current returns (expressed as a negative value to signify loss) exceed the average VaR value. If the current returns surpass the calculated VaR threshold, this indicates that the actual market risk is higher than expected, signaling a potential shift in market conditions.
2. Break Analysis: In addition to monitoring whether returns exceed the average VaR, the script counts the number of instances within the lookback period where this breach occurs. This is referred to as the "break effect." For each period in the lookback window, the script checks whether the returns surpass the calculated VaR threshold and increments a counter. The percentage of periods where this breach occurs is then calculated as the "effect" or break percentage.
3. Dual Effect Check (if "Double" Risk Scenario is selected): When the user chooses the "Double" risk scenario mode, the script performs two layers of analysis. First, it calculates the effect of returns exceeding the VaR threshold for the current timeframe. Then, it calculates the effect for the lower intraday timeframe as well. Both effects are compared to the user-defined confidence level (e.g., 95%). If both effects exceed the confidence level, the market is deemed to be in a high-risk situation, thus triggering a Risk Off phase. If both effects fall below the confidence level, the market is classified as Risk On.
4. Risk Phases Determination: The final risk phase is determined by analyzing these effects in relation to the confidence level:
- Risk On: If the calculated effect of breaks is lower than the confidence level (e.g., fewer than 5% of periods show returns exceeding the VaR threshold for a 95% confidence level), the market is considered to be in a relatively safe state, and the script signals a "Risk On" phase. This is indicative of bullish conditions where the potential for extreme loss is minimal.
- Risk Off: If the break effect exceeds the confidence level (e.g., more than 5% of periods show returns breaching the VaR threshold), the market is deemed to be in a high-risk state, and the script signals a "Risk Off" phase. This indicates bearish market conditions where the likelihood of significant losses is higher.
- Risk Neutral: If the break effect hovers near the confidence level or if there is no clear trend indicating a shift toward either extreme, the market is classified as "Risk Neutral." In this phase, neither bulls nor bears are dominant, and traders should remain cautious.
The phase color that the script uses helps visualize these risk phases. The background will turn green in Risk On conditions, red in Risk Off conditions, and gray in Risk Neutral phases, providing immediate visual feedback on market risk. In addition to this, when the "Double" risk scenario is selected, the background will only turn green or red if both the current and intraday timeframes confirm the respective risk phase. This double-checking process ensures that traders are only given a strong signal when both longer-term and short-term risks align, reducing the likelihood of false signals.
A New Way of Using Value at Risk
This innovative Risk On/Risk Off classification, based on the interaction between VaR thresholds and market returns, represents a significant departure from the traditional use of Value at Risk as a pure risk measurement tool. Typically, VaR is employed as a backward-looking measure of risk, providing a static estimate of potential losses over a given timeframe with no immediate actionable feedback on current market conditions. This script, however, dynamically interprets VaR results to create a forward-looking, real-time signal that informs traders whether they are operating in a favorable (Risk On) or unfavorable (Risk Off) environment.
By incorporating the "break effect" analysis and allowing users to view the VaR breaches as a percentage of past occurrences, the script adds a predictive element that can be used to time market entries and exits more effectively. This **dual-layer risk analysis**, particularly when using the "Double" scenario mode, adds further granularity by considering both current timeframe and intraday risks. Traders can therefore make more informed decisions not just based on historical risk data, but on how the market is behaving in real-time relative to those risk benchmarks.
This approach transforms the VaR indicator from a risk monitoring tool into a decision-making system that helps identify favorable trading opportunities while alerting users to potential market downturns. It provides a more holistic view of market conditions by combining both statistical risk measurement and intuitive phase-based market analysis. This level of integration between VaR methodologies and real-time signal generation has not been widely seen in the world of trading indicators, marking this script as a cutting-edge tool for risk management and market sentiment analysis.
I would like to express my sincere gratitude to skewedzeta for his invaluable contribution to the final script. From generating fresh ideas to applying his expertise in reviewing the formula, his support has been instrumental in refining the outcome.
Concept of Value at Risk
Value at Risk (VaR) is a statistical technique used to measure the likelihood of losses in a portfolio or financial asset due to market risks. In essence, it answers the question: "What is the maximum potential loss that could occur in a given portfolio over a specific time horizon, with a certain confidence level?" For instance, if a portfolio has a one-day 95% VaR of $10,000, it means that there is a 95% chance the portfolio will not lose more than $10,000 in a single day. Conversely, there is a 5% chance of losing more than $10,000. VaR is a key risk management tool for portfolio managers and traders because it quantifies potential losses in monetary terms, allowing for better-informed decision-making.
There are several ways to calculate VaR, and this indicator script incorporates three of the most commonly used models:
Historical VaR: This approach uses historical returns to estimate potential losses. It is based purely on past price data, assuming that the past distribution of returns is indicative of future risks.
Variance-Covariance VaR: This model assumes that asset returns follow a normal distribution and that the risk can be summarized using the mean and standard deviation of past returns. It is a parametric method that is widely used in financial risk management.
Exponentially Weighted Moving Average (EWMA) VaR: In this model, recent data points are given more weight than older data. This dynamic approach allows the VaR estimation to react more quickly to changes in market volatility, which is particularly useful during periods of market stress. This model uses the Exponential Weighted Moving Average Volatility Model.
How the Script Works
The script starts by offering users a set of customizable input settings. The first input allows the user to choose between two main calculation modes: "All" or "OCT" (Only Current Timeframe). In the "All" mode, the script calculates VaR using all available methodologies—Historical, Variance-Covariance, and EWMA—providing a comprehensive risk overview. The "OCT" mode narrows the calculation to the current timeframe, which can be particularly useful for intraday traders who need a more focused view of risk.
The next input is the lookback window, which defines the number of historical periods used to calculate VaR. Commonly used lookback periods include 21 days (approximately one month), 63 days (about three months), and 252 days (roughly one year), with the script supporting up to 504 days for more extended historical analysis. A longer lookback period provides a more comprehensive picture of risk but may be less responsive to recent market conditions.
The confidence level is another important setting in the script. This represents the probability that the loss will not exceed the VaR estimate. Standard confidence levels are 90%, 95%, and 99%. A higher confidence level results in a more conservative risk estimate, meaning that the calculated VaR will reflect a more extreme loss scenario.
In addition to these core settings, the script allows users to customize the visual appearance of the indicator. For example, traders can choose different colors for "Bullish" (Risk On), "Bearish" (Risk Off), and "Neutral" phases, as well as colors for highlighting "Breaks" in the data, where returns exceed the calculated VaR. These visual cues make it easy to identify periods of heightened risk at a glance.
The actual VaR calculation is broken down into several models, starting with the Historical VaR calculation. This is done by computing the logarithmic returns of the asset's closing prices and then using linear interpolation to determine the percentile corresponding to the desired confidence level. This percentile represents the potential loss in the asset over the lookback period.
Next, the script calculates Variance-Covariance VaR using the mean and standard deviation of the historical returns. The standard deviation is multiplied by a z-score corresponding to the chosen confidence level (e.g., 1.645 for 95% confidence), and the resulting value is subtracted from the mean return to arrive at the VaR estimate.
The EWMA VaR model uses the EWMA for the sigma parameter, the standard deviation, obtaining a specific dynamic in the volatility. It is particularly useful in volatile markets where recent price behavior is more indicative of future risk than older data.
For traders interested in intraday risk management, the script provides several methods to adjust VaR calculations for lower timeframes. By using intraday returns and scaling them according to the chosen timeframe, the script provides a dynamic view of risk throughout the trading day. This is especially important for short-term traders who need to manage their exposure during high-volatility periods within the same day. The script also incorporates an EWMA model for intraday data, which gives greater weight to the most recent intraday price movements.
In addition to calculating VaR, the script also attempts to detect periods where the asset's returns exceed the estimated VaR threshold, referred to as "Breaks." When the returns breach the VaR limit, the script highlights these instances on the chart, allowing traders to quickly identify periods of extreme risk. The script also calculates the average of these breaks and displays it for comparison, helping traders understand how frequently these high-risk periods occur.
The script further visualizes the risk scenario using a risk phase classification system. Depending on the level of risk, the script categorizes the market as either "Risk On," "Risk Off," or "Risk Neutral." In "Risk On" mode, the market is considered bullish, and the indicator displays a green background. In "Risk Off" mode, the market is bearish, and the background turns red. If the market is neither strongly bullish nor bearish, the background turns neutral, signaling a balanced risk environment.
Traders can customize whether they want to see this risk phase background, along with toggling the display of the various VaR models, the intraday methods, and the break signals. This flexibility allows traders to tailor the indicator to their specific needs, whether they are day traders looking for quick intraday insights or longer-term investors focused on historical risk analysis.
The "Risk On" and "Risk Off" phases calculated by this Value at Risk (VaR) script introduce a novel approach to market risk assessment, offering traders an advanced toolset to gauge market sentiment and potential risk levels dynamically. These risk phases are built on a combination of traditional VaR methodologies and proprietary logic to create a more responsive and intuitive way to manage exposure in both normal and volatile market conditions. This method of classifying market conditions into "Risk On," "Risk Off," or "Risk Neutral" is not something that has been traditionally associated with VaR, making it a groundbreaking addition to this indicator.
How the "Risk On" and "Risk Off" Phases Are Calculated
In typical VaR implementations, the focus is on calculating the potential losses at a given confidence level without providing an overall market outlook. This script, however, introduces a unique risk classification system that takes the output of various VaR models and translates it into actionable signals for traders, marking whether the market is in a Risk On, Risk Off, or Risk Neutral phase.
The Risk On and Risk Off phases are primarily determined by comparing the current returns of the asset to the average VaR calculated across several different methods, including Historical VaR, Variance-Covariance VaR, and EWMA VaR. Here's how the process works:
1. Threshold Setting and Effect Calculation: The script first computes the average VaR using the selected models. It then checks whether the current returns (expressed as a negative value to signify loss) exceed the average VaR value. If the current returns surpass the calculated VaR threshold, this indicates that the actual market risk is higher than expected, signaling a potential shift in market conditions.
2. Break Analysis: In addition to monitoring whether returns exceed the average VaR, the script counts the number of instances within the lookback period where this breach occurs. This is referred to as the "break effect." For each period in the lookback window, the script checks whether the returns surpass the calculated VaR threshold and increments a counter. The percentage of periods where this breach occurs is then calculated as the "effect" or break percentage.
3. Dual Effect Check (if "Double" Risk Scenario is selected): When the user chooses the "Double" risk scenario mode, the script performs two layers of analysis. First, it calculates the effect of returns exceeding the VaR threshold for the current timeframe. Then, it calculates the effect for the lower intraday timeframe as well. Both effects are compared to the user-defined confidence level (e.g., 95%). If both effects exceed the confidence level, the market is deemed to be in a high-risk situation, thus triggering a Risk Off phase. If both effects fall below the confidence level, the market is classified as Risk On.
4. Risk Phases Determination: The final risk phase is determined by analyzing these effects in relation to the confidence level:
- Risk On: If the calculated effect of breaks is lower than the confidence level (e.g., fewer than 5% of periods show returns exceeding the VaR threshold for a 95% confidence level), the market is considered to be in a relatively safe state, and the script signals a "Risk On" phase. This is indicative of bullish conditions where the potential for extreme loss is minimal.
- Risk Off: If the break effect exceeds the confidence level (e.g., more than 5% of periods show returns breaching the VaR threshold), the market is deemed to be in a high-risk state, and the script signals a "Risk Off" phase. This indicates bearish market conditions where the likelihood of significant losses is higher.
- Risk Neutral: If the break effect hovers near the confidence level or if there is no clear trend indicating a shift toward either extreme, the market is classified as "Risk Neutral." In this phase, neither bulls nor bears are dominant, and traders should remain cautious.
The phase color that the script uses helps visualize these risk phases. The background will turn green in Risk On conditions, red in Risk Off conditions, and gray in Risk Neutral phases, providing immediate visual feedback on market risk. In addition to this, when the "Double" risk scenario is selected, the background will only turn green or red if both the current and intraday timeframes confirm the respective risk phase. This double-checking process ensures that traders are only given a strong signal when both longer-term and short-term risks align, reducing the likelihood of false signals.
A New Way of Using Value at Risk
This innovative Risk On/Risk Off classification, based on the interaction between VaR thresholds and market returns, represents a significant departure from the traditional use of Value at Risk as a pure risk measurement tool. Typically, VaR is employed as a backward-looking measure of risk, providing a static estimate of potential losses over a given timeframe with no immediate actionable feedback on current market conditions. This script, however, dynamically interprets VaR results to create a forward-looking, real-time signal that informs traders whether they are operating in a favorable (Risk On) or unfavorable (Risk Off) environment.
By incorporating the "break effect" analysis and allowing users to view the VaR breaches as a percentage of past occurrences, the script adds a predictive element that can be used to time market entries and exits more effectively. This **dual-layer risk analysis**, particularly when using the "Double" scenario mode, adds further granularity by considering both current timeframe and intraday risks. Traders can therefore make more informed decisions not just based on historical risk data, but on how the market is behaving in real-time relative to those risk benchmarks.
This approach transforms the VaR indicator from a risk monitoring tool into a decision-making system that helps identify favorable trading opportunities while alerting users to potential market downturns. It provides a more holistic view of market conditions by combining both statistical risk measurement and intuitive phase-based market analysis. This level of integration between VaR methodologies and real-time signal generation has not been widely seen in the world of trading indicators, marking this script as a cutting-edge tool for risk management and market sentiment analysis.
I would like to express my sincere gratitude to skewedzeta for his invaluable contribution to the final script. From generating fresh ideas to applying his expertise in reviewing the formula, his support has been instrumental in refining the outcome.
Скрипт с открытым кодом
В истинном духе TradingView, создатель этого скрипта сделал его открытым исходным кодом, чтобы трейдеры могли проверить и убедиться в его функциональности. Браво автору! Вы можете использовать его бесплатно, но помните, что перепубликация кода подчиняется нашим Правилам поведения.
Отказ от ответственности
Информация и публикации не предназначены для предоставления и не являются финансовыми, инвестиционными, торговыми или другими видами советов или рекомендаций, предоставленных или одобренных TradingView. Подробнее читайте в Условиях использования.