PROTECTED SOURCE SCRIPT
Ultra-High-Reliability Trading Signals Suite v7
What it is
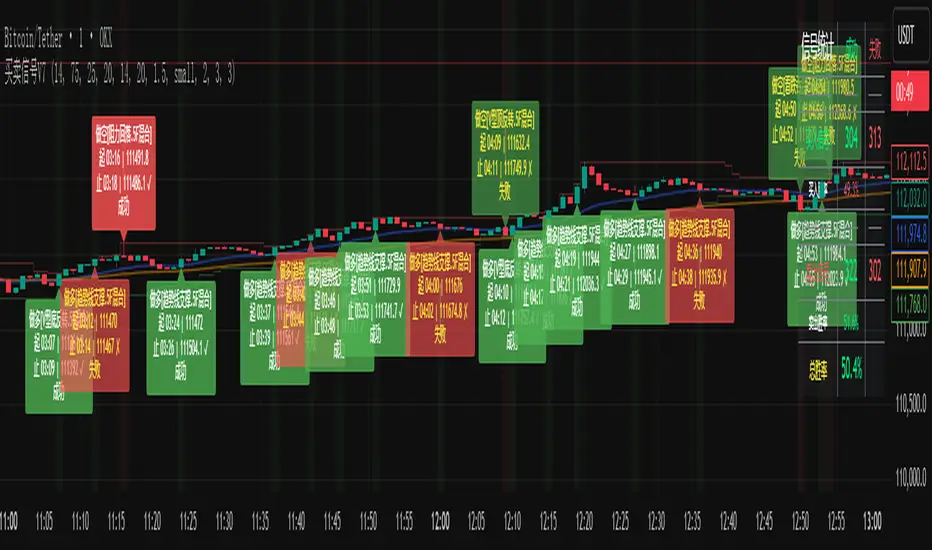
A lightweight overlay that prints one arrow at a time—green for “go long”, red for “go short”—and then watches its own prediction for a user-defined number of bars. After the timer expires the arrow is automatically graded “✓” or “✗”, the result is written on the chart and a running scoreboard is updated.
What you see
One arrow per side only—no clutter, no repainting.
A small label that follows price and shows entry time/price, exit time/price and the final verdict.
Two EMAs and step-wise support/resistance lines for visual context.
An optional top-right table that tracks win counts, loss counts and hit-rate for longs, shorts and the combined set.
Core philosophy (no formulas)
Confluence first – every arrow needs at least three independent clues to line up (momentum, micro-structure, volume, higher-time-frame bias, etc.).
Location matters – signals near well-defined support or resistance zones are favoured; signals in the middle of nowhere are discarded.
Quality over quantity – a built-in scoring engine ranks each set-up; only the top percentile is shown.
Self-audit – every arrow is followed for N bars, graded, and stored so the script can display a live track-record instead of a beauty picture.
User knobs you can turn without touching code
Sensitivity dial – choose “strict” for fewer but higher-conviction arrows or “normal” for a fuller set.
Timer length – decide how many bars the script should wait before marking the trade right or wrong.
Visual prefs – toggle arrows, labels, background flashes, auxiliary lines and the statistics table.
Time-frame blend – optionally pull in a faster or slower compression to confirm the bigger picture.
Typical workflow
Drop the indicator on any intraday chart (5 min is the most popular).
Wait for an arrow that agrees with your higher-time-frame bias.
Use the timer as a built-in exit rule or as a back-stop for your own target/stop.
Watch the scoreboard for a few sessions; if the win-rate stays above your personal threshold you can gradually increase size, if it drops you re-calibrate or pause.
No magic, just a disciplined checklist that prints its own report card in real time.
Скрипт с защищённым кодом
Этот скрипт опубликован с закрытым исходным кодом. Однако вы можете использовать его свободно и без каких-либо ограничений — читайте подробнее здесь.
Отказ от ответственности
Все виды контента, которые вы можете увидеть на TradingView, не являются финансовыми, инвестиционными, торговыми или любыми другими рекомендациями. Мы не предоставляем советы по покупке и продаже активов. Подробнее — в Условиях использования TradingView.