OPEN-SOURCE SCRIPT
Support & Resistance Dynamic [LuxAlgo]
The Support & Resistance Dynamic indicator aims to return real-time predictive support and resistance zones that are relevant to a detected trend. This makes this indicator similar to our previously published Predictive Ranges indicator.
Users can additionally extend the most recent historical support and resistance zones.
🔶 USAGE

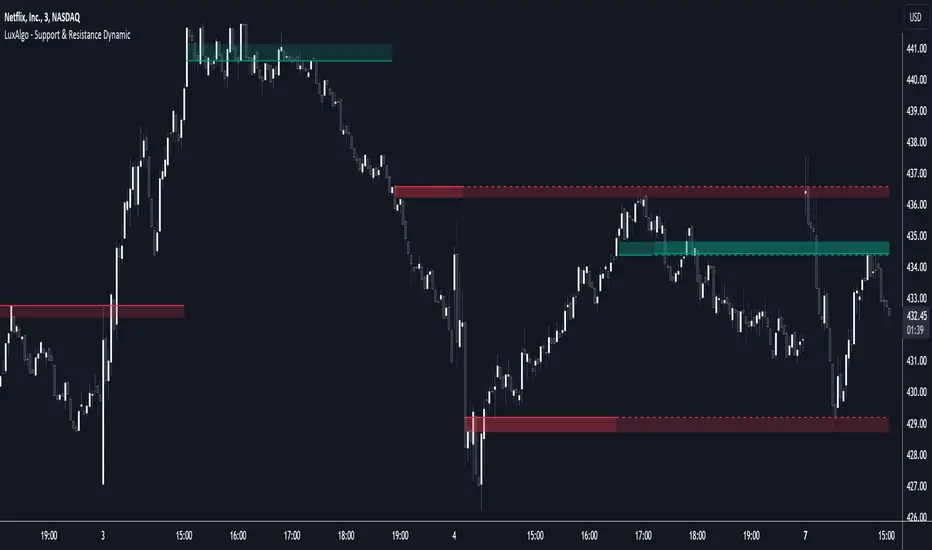
Hypothetical resistance levels in an up-trend or supports in a down-trend would tend to be broken more easily, as such the indicator primary objective is to return reliable real-time support and resistance levels by taking this into account.

When the market is up-trending the indicator will only return support zones, while a down-trending market will cause the indicator to only return resistance zones.

If the price significantly breaks a support/resistance, rendering it unreliable, it can be a sign of a potential reversal.

Users can return support/resistance levels/zones for shorter-term trends by reducing the Multiplicative Factor setting.
🔹 Extension

Users can extend past estimated support/resistance levels, the amount of extended levels is determined by the users. Certain levels can stay relevant in the future, and can also aid in measuring the significance of a breakout, with further past levels being reached being indicative of more significant trends.
🔶 DETAILS
To determine if the price is up-trending or down-trending in order to show either support or resistance, the same method used in the predictive ranges script is used. A central tendency is estimated, if price significantly deviates from it upward an uptrend is detected, else a significant deviation downward would indicate a downtrend.
The central tendency estimate is used for the construction of the support and resistance levels.
🔶 SETTINGS
Users can additionally extend the most recent historical support and resistance zones.
🔶 USAGE
Hypothetical resistance levels in an up-trend or supports in a down-trend would tend to be broken more easily, as such the indicator primary objective is to return reliable real-time support and resistance levels by taking this into account.
When the market is up-trending the indicator will only return support zones, while a down-trending market will cause the indicator to only return resistance zones.
If the price significantly breaks a support/resistance, rendering it unreliable, it can be a sign of a potential reversal.
Users can return support/resistance levels/zones for shorter-term trends by reducing the Multiplicative Factor setting.
🔹 Extension
Users can extend past estimated support/resistance levels, the amount of extended levels is determined by the users. Certain levels can stay relevant in the future, and can also aid in measuring the significance of a breakout, with further past levels being reached being indicative of more significant trends.
🔶 DETAILS
To determine if the price is up-trending or down-trending in order to show either support or resistance, the same method used in the predictive ranges script is used. A central tendency is estimated, if price significantly deviates from it upward an uptrend is detected, else a significant deviation downward would indicate a downtrend.
The central tendency estimate is used for the construction of the support and resistance levels.
🔶 SETTINGS
- Multiplicative Factor: Determines the frequency at which new supports/resistances are returned, with lower values returning more frequent levels/zones.
- ATR Length: ATR averaging length used as deviation threshold for the central tendency estimate.
- Extend Last: Determines the amount of most recent historical supports/resistances to extend to the latest bar.
Скрипт с открытым кодом
В истинном духе TradingView, создатель этого скрипта сделал его открытым исходным кодом, чтобы трейдеры могли проверить и убедиться в его функциональности. Браво автору! Вы можете использовать его бесплатно, но помните, что перепубликация кода подчиняется нашим Правилам поведения.
Get exclusive indicators & AI trading strategies: luxalgo.com
Free 150k+ community: discord.gg/lux
All content provided by LuxAlgo is for informational & educational purposes only. Past performance does not guarantee future results.
Free 150k+ community: discord.gg/lux
All content provided by LuxAlgo is for informational & educational purposes only. Past performance does not guarantee future results.
Отказ от ответственности
Информация и публикации не предназначены для предоставления и не являются финансовыми, инвестиционными, торговыми или другими видами советов или рекомендаций, предоставленных или одобренных TradingView. Подробнее читайте в Условиях использования.