OPEN-SOURCE SCRIPT
true trend
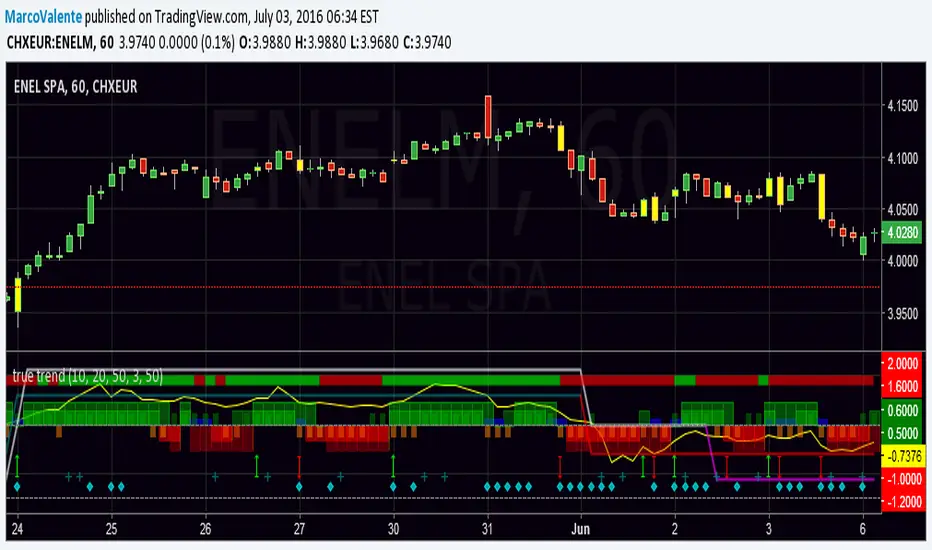
Easy way to look at the Trend , but still accurate. Top bar is DI +, DI - , bars change in yellow when a swing happen, histogram show the increase/decrease of Min and Max and Open-Close; 2 lines moving between +1 and - 1 folloiwng 3 Ema crossing ; a Dot (diamond shape) appear on the botton when volatility increase and finally a " + " show when volume are much bigger the usually. Yellow line on top is Willams % and help us to find top and bottom of the market.
Скрипт с открытым кодом
В истинном духе TradingView, создатель этого скрипта сделал его открытым исходным кодом, чтобы трейдеры могли проверить и убедиться в его функциональности. Браво автору! Вы можете использовать его бесплатно, но помните, что перепубликация кода подчиняется нашим Правилам поведения.
Отказ от ответственности
Информация и публикации не предназначены для предоставления и не являются финансовыми, инвестиционными, торговыми или другими видами советов или рекомендаций, предоставленных или одобренных TradingView. Подробнее читайте в Условиях использования.