OPEN-SOURCE SCRIPT
Team Undergrounds Magic RSI Bands
What is this indicator?
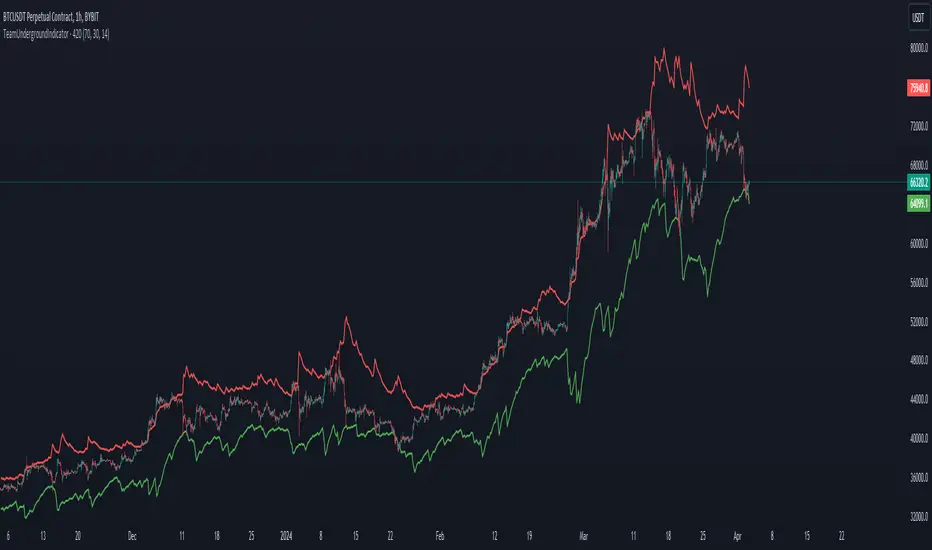
This indicator shows RSI but visualize as bands with custom timeframe settings. Normal RSI doesn't really visualse well when the price gets overbought/oversold and generally because of candle closes it can be hard to determine if the price has already touched the prefered RSI level. The custom timeframe allows you to go to shorter or longer timeframes on the chart while maintaining the same timeframe on the RSI indicator.
How does it work?
Add this indicator to the chart, and you'll see 2 bands (green and red). By standard settings, the green band shows when price goes below 30 RSI and the red line when price goes above 70 on the RSI. By standard settings the RSI band is set to 7 hour because this tends to work well with Bitcoin and crypto in general, but the timeframe can be changed in the settings. 12hr, 3hr, 3D, 1W are all good timeframes based off personal preference. The overbought/oversold level and RSI length can also be adjusted.
Indicator is not a financial advice tool, and offcourse, data can always change. Past price does not predict future price by defintion.
Скрипт с открытым кодом
В истинном духе TradingView, создатель этого скрипта сделал его открытым исходным кодом, чтобы трейдеры могли проверить и убедиться в его функциональности. Браво автору! Вы можете использовать его бесплатно, но помните, что перепубликация кода подчиняется нашим Правилам поведения.
Отказ от ответственности
Информация и публикации не предназначены для предоставления и не являются финансовыми, инвестиционными, торговыми или другими видами советов или рекомендаций, предоставленных или одобренных TradingView. Подробнее читайте в Условиях использования.