OPEN-SOURCE SCRIPT
Обновлено Pearson Correlation [Mr_Rakun]
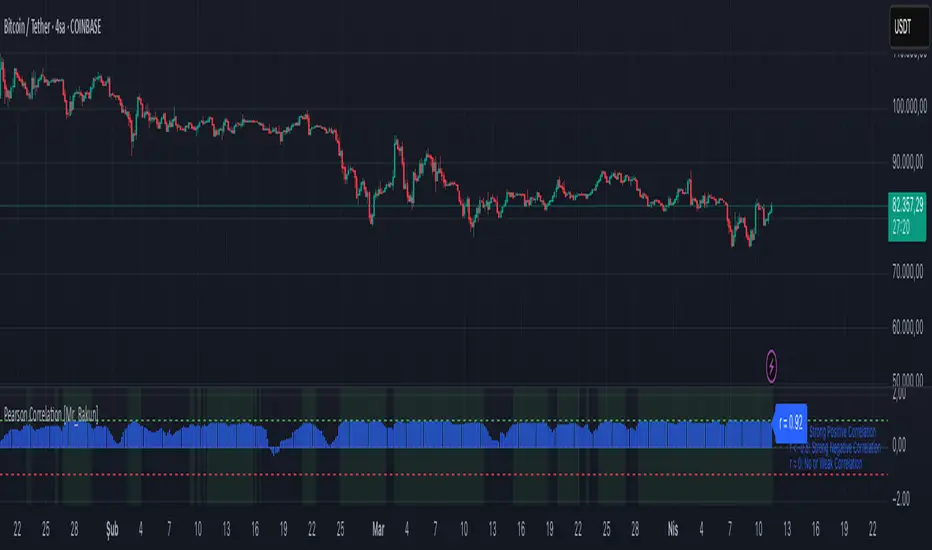
Pearson Correlation
This script calculates the Pearson correlation coefficient (r) between the closing price of the current asset and another selected asset.
🔍 How It Works:
• The user selects a correlation period (default: 20) and a symbol (default: ETH/USDT).
• The script retrieves the closing prices of both assets.
• The Pearson correlation formula is applied:
r = \frac{n(\sum xy) - (\sum x)(\sum y)}{\sqrt{[n\sum x^2 - (\sum x)^2][n\sum y^2 - (\sum y)^2]}}
• The correlation is plotted as a histogram:
• +1 (green line) → Perfect positive correlation
• -1 (red line) → Perfect negative correlation
• 0 (gray line) → No correlation
📊 Why Use This?
This indicator helps traders identify relationships between assets, such as whether two markets move together or inversely. It is useful for hedging strategies, portfolio diversification, and market comparisons.
Информация о релизе
- InfoСкрипт с открытым кодом
В истинном духе TradingView, создатель этого скрипта сделал его открытым исходным кодом, чтобы трейдеры могли проверить и убедиться в его функциональности. Браво автору! Вы можете использовать его бесплатно, но помните, что перепубликация кода подчиняется нашим Правилам поведения.
Отказ от ответственности
Информация и публикации не предназначены для предоставления и не являются финансовыми, инвестиционными, торговыми или другими видами советов или рекомендаций, предоставленных или одобренных TradingView. Подробнее читайте в Условиях использования.
Скрипт с открытым кодом
В истинном духе TradingView, создатель этого скрипта сделал его открытым исходным кодом, чтобы трейдеры могли проверить и убедиться в его функциональности. Браво автору! Вы можете использовать его бесплатно, но помните, что перепубликация кода подчиняется нашим Правилам поведения.
Отказ от ответственности
Информация и публикации не предназначены для предоставления и не являются финансовыми, инвестиционными, торговыми или другими видами советов или рекомендаций, предоставленных или одобренных TradingView. Подробнее читайте в Условиях использования.