OPEN-SOURCE SCRIPT
Emas cryptosmart
## General Summary
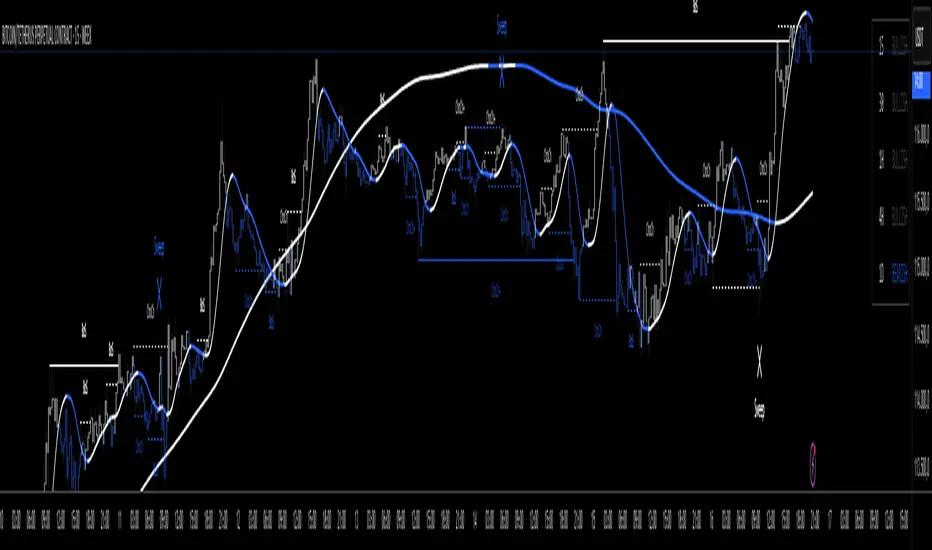
The Emas cryptosmart indicator is a technical analysis tool designed to provide a clear and comprehensive view of the market trend. It combines a long-term Hull Moving Average (HMA) to establish the overall trend with a faster, more responsive Triple Hull Moving Average (THMA) to identify short-term momentum.
Its primary feature is the dynamic candle coloring, which offers immediate visual cues about price direction, simplifying trading decisions.
## Indicator Components
This indicator is composed of two main lines:
Hull 200 (HMA): The Long-Term Trend Anchor
This line (dynamic lime/red by default) acts as a filter for the main market trend. Due to its 200-period setting, it moves smoothly and establishes the general context.
Uptrend: When the Hull 200 is rising (lime color), it indicates the macro trend is bullish.
Downtrend: When it is falling (red color), the macro trend is bearish.
THMA 55: The Short-Term Momentum Line
This line (dynamic aqua/orange by default) is a Triple Hull Moving Average. It is extremely fast and sensitive to recent price changes, designed to capture immediate momentum.
This is the key line for the candle coloring and for identifying potential entry or exit points.
## How to Interpret It
The primary strategy is to use the Hull 200 to define the direction for your trades and the THMA 55 to fine-tune your timing.
Candle Coloring (Main Signal):
Bullish Candles (default: aqua): When the price closes above the THMA 55, the candles turn to a bullish color. This signals that immediate momentum is positive and can be considered a buy signal or confirmation to stay in a long position.
Bearish Candles (default: orange): When the price closes below the THMA 55, the candles turn to a bearish color. This indicates that immediate momentum is negative, suggesting a potential sell or an exit from a long position.
Confluence Strategy:
The highest-probability signals occur when both moving averages are aligned.
Strong Buy Example: Look for a situation where the Hull 200 is rising (lime color) and wait for the candles to turn bullish as the price crosses above the THMA 55.
Strong Sell Example: Look for a situation where the Hull 200 is falling (red color) and wait for the candles to turn bearish as the price crosses below the THMA 55.
## Key Features
Visual Clarity: Automatic candle coloring eliminates the need to constantly interpret crosses, allowing for a quick read of the market's state.
Dual Perspective: Offers a balanced view by combining a slow trend indicator with a fast momentum indicator.
Reduced Lag: The use of Hull variants minimizes the delay typical of conventional moving averages (SMAs/EMAs).
Fully Customizable: All colors, for both the lines and the candles, can be adjusted in the settings menu to fit your visual style.
Скрипт с открытым кодом
В истинном духе TradingView, создатель этого скрипта сделал его открытым исходным кодом, чтобы трейдеры могли проверить и убедиться в его функциональности. Браво автору! Вы можете использовать его бесплатно, но помните, что перепубликация кода подчиняется нашим Правилам поведения.
Отказ от ответственности
Информация и публикации не предназначены для предоставления и не являются финансовыми, инвестиционными, торговыми или другими видами советов или рекомендаций, предоставленных или одобренных TradingView. Подробнее читайте в Условиях использования.