OPEN-SOURCE SCRIPT
Dominant Period-Based Moving Average (DPBMA)
Exploit Market Cycles with the Dominant Period-Based Moving Average Indicator
Introduction:
In the world of trading, market cycles play a crucial role in determining the rhythm of the market. These cycles often consist of recurring patterns that traders can exploit to maximize their profits. One effective way to capitalize on these cycles is by using a moving average (MA) indicator. Today, we are going to introduce you to a unique indicator that takes the most frequent dominant period of the market and uses it as the length of the moving average. This indicator is designed to adapt to the ever-changing market conditions, providing traders with a dynamic tool to better analyze the market.
Dominant Period-Based Moving Average Indicator Overview:
The Dominant Period-Based Moving Average (DPBMA) Indicator is a custom indicator designed to find the most frequent dominant period of the market and use that period as the length of the moving average. This innovative approach allows the indicator to adapt to the market cycles, making it more responsive to the market's changing conditions.
Here's a quick overview of the DPBMA Indicator's features:
Takes the most frequent dominant period of the market.
Uses the dominant period as the length of the moving average.
Adapts to the changing market cycles.
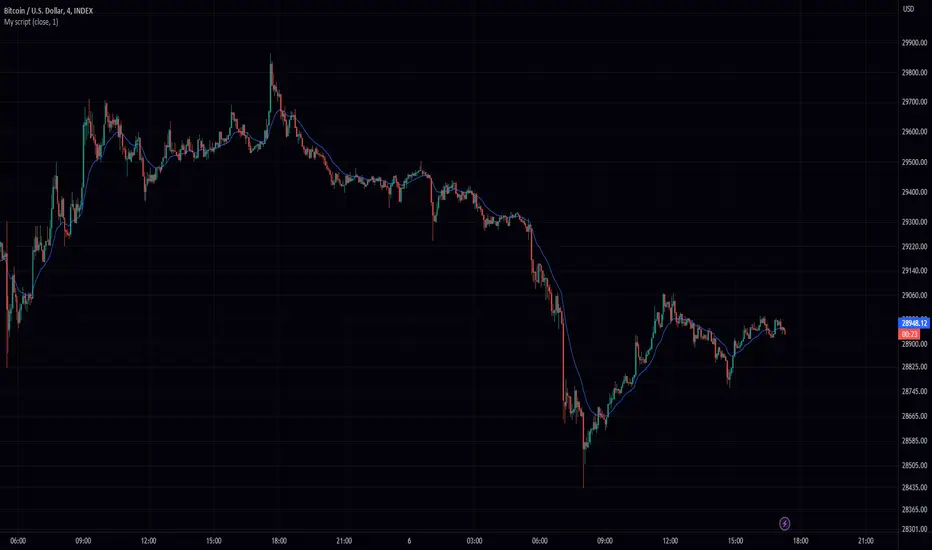
Works as an overlay on your price chart.
Using the Dominant Period-Based Moving Average Indicator:
How the Dominant Period-Based Moving Average Indicator Works:
The DPBMA Indicator works by first importing the DominantCycle function from the lastguru/DominantCycle/2 script. This function calculates the dominant cycle period of the given market data. The DPBMA Indicator then calculates the Exponential Moving Average (EMA) using the dominant period as the length parameter.
The EMA calculation uses an alpha factor, which is calculated as 2 / (length + 1). The alpha factor is then used to smooth the source data (closing prices) and calculate the adaptive moving average.
The DPBMA Indicator also includes a harmonic input, which allows you to multiply the dominant cycle period by an integer value. This can help you fine-tune the indicator to better fit your trading strategy or style.
The Raw Dominant Frequency:
The raw dominant frequency represents the primary cycle period present in the given market data. By identifying the raw dominant frequency, traders can gain insights into the market's current cycle and use this information to make informed trading decisions. The raw dominant frequency can be useful for detecting major trend reversals, support and resistance levels, and potential entry and exit points.
However, using the raw dominant frequency alone has its limitations. For instance, it may not always provide a clear picture of the market's prevailing trend, especially during periods of high market volatility. Additionally, relying solely on the raw dominant frequency may not capture the nuances of shorter-term cycles that can also impact price movements.
The Most Likely Dominant Frequency:
Our approach takes a different angle by focusing on the most likely dominant frequency. This method aims to identify the frequency with the highest probability of being the dominant frequency in the market data. The idea behind this approach is to filter out potential noise and improve the accuracy of the dominant frequency analysis. By using the most likely dominant frequency, traders can gain a more reliable understanding of the market's primary cycle, which can lead to better trading decisions.
In our Dominant Period-Based Moving Average Indicator, we calculate the most likely dominant frequency by analyzing an array of cycle periods and their occurrences in the given market data. We then determine the cycle period with the highest occurrence, representing the most likely dominant frequency. This method allows the indicator to be more adaptive and responsive to the changing market conditions, capturing the nuances of both long-term and short-term cycles.
Why Not the Average Dominant Frequency?
While using the average dominant frequency might seem like a reasonable approach, it can be less effective in accurately capturing the market's primary cycle. Averaging the dominant frequencies may dilute the impact of the true dominant frequency, resulting in a less accurate representation of the market's current cycle. By focusing on the most likely dominant frequency, our approach provides a more accurate and reliable analysis of the market's primary cycle, which can ultimately lead to more effective trading decisions.
Conclusion:
The Dominant Period-Based Moving Average Indicator, enhanced with the most likely dominant frequency approach, offers traders a powerful tool for exploiting market cycles. By adapting to the most frequent dominant period and focusing on the most likely dominant frequency, this indicator provides a more accurate and reliable analysis of the market's primary cycle. As a result, traders can make better-informed decisions, ultimately leading to improved trading performance. Incorporate the DPBMA Indicator into your trading toolbox today, and take advantage of the enhanced market analysis it provides.
Introduction:
In the world of trading, market cycles play a crucial role in determining the rhythm of the market. These cycles often consist of recurring patterns that traders can exploit to maximize their profits. One effective way to capitalize on these cycles is by using a moving average (MA) indicator. Today, we are going to introduce you to a unique indicator that takes the most frequent dominant period of the market and uses it as the length of the moving average. This indicator is designed to adapt to the ever-changing market conditions, providing traders with a dynamic tool to better analyze the market.
Dominant Period-Based Moving Average Indicator Overview:
The Dominant Period-Based Moving Average (DPBMA) Indicator is a custom indicator designed to find the most frequent dominant period of the market and use that period as the length of the moving average. This innovative approach allows the indicator to adapt to the market cycles, making it more responsive to the market's changing conditions.
Here's a quick overview of the DPBMA Indicator's features:
Takes the most frequent dominant period of the market.
Uses the dominant period as the length of the moving average.
Adapts to the changing market cycles.
Works as an overlay on your price chart.
Using the Dominant Period-Based Moving Average Indicator:
How the Dominant Period-Based Moving Average Indicator Works:
The DPBMA Indicator works by first importing the DominantCycle function from the lastguru/DominantCycle/2 script. This function calculates the dominant cycle period of the given market data. The DPBMA Indicator then calculates the Exponential Moving Average (EMA) using the dominant period as the length parameter.
The EMA calculation uses an alpha factor, which is calculated as 2 / (length + 1). The alpha factor is then used to smooth the source data (closing prices) and calculate the adaptive moving average.
The DPBMA Indicator also includes a harmonic input, which allows you to multiply the dominant cycle period by an integer value. This can help you fine-tune the indicator to better fit your trading strategy or style.
The Raw Dominant Frequency:
The raw dominant frequency represents the primary cycle period present in the given market data. By identifying the raw dominant frequency, traders can gain insights into the market's current cycle and use this information to make informed trading decisions. The raw dominant frequency can be useful for detecting major trend reversals, support and resistance levels, and potential entry and exit points.
However, using the raw dominant frequency alone has its limitations. For instance, it may not always provide a clear picture of the market's prevailing trend, especially during periods of high market volatility. Additionally, relying solely on the raw dominant frequency may not capture the nuances of shorter-term cycles that can also impact price movements.
The Most Likely Dominant Frequency:
Our approach takes a different angle by focusing on the most likely dominant frequency. This method aims to identify the frequency with the highest probability of being the dominant frequency in the market data. The idea behind this approach is to filter out potential noise and improve the accuracy of the dominant frequency analysis. By using the most likely dominant frequency, traders can gain a more reliable understanding of the market's primary cycle, which can lead to better trading decisions.
In our Dominant Period-Based Moving Average Indicator, we calculate the most likely dominant frequency by analyzing an array of cycle periods and their occurrences in the given market data. We then determine the cycle period with the highest occurrence, representing the most likely dominant frequency. This method allows the indicator to be more adaptive and responsive to the changing market conditions, capturing the nuances of both long-term and short-term cycles.
Why Not the Average Dominant Frequency?
While using the average dominant frequency might seem like a reasonable approach, it can be less effective in accurately capturing the market's primary cycle. Averaging the dominant frequencies may dilute the impact of the true dominant frequency, resulting in a less accurate representation of the market's current cycle. By focusing on the most likely dominant frequency, our approach provides a more accurate and reliable analysis of the market's primary cycle, which can ultimately lead to more effective trading decisions.
Conclusion:
The Dominant Period-Based Moving Average Indicator, enhanced with the most likely dominant frequency approach, offers traders a powerful tool for exploiting market cycles. By adapting to the most frequent dominant period and focusing on the most likely dominant frequency, this indicator provides a more accurate and reliable analysis of the market's primary cycle. As a result, traders can make better-informed decisions, ultimately leading to improved trading performance. Incorporate the DPBMA Indicator into your trading toolbox today, and take advantage of the enhanced market analysis it provides.
Скрипт с открытым кодом
В истинном духе TradingView, создатель этого скрипта сделал его открытым исходным кодом, чтобы трейдеры могли проверить и убедиться в его функциональности. Браво автору! Вы можете использовать его бесплатно, но помните, что перепубликация кода подчиняется нашим Правилам поведения.
Отказ от ответственности
Информация и публикации не предназначены для предоставления и не являются финансовыми, инвестиционными, торговыми или другими видами советов или рекомендаций, предоставленных или одобренных TradingView. Подробнее читайте в Условиях использования.