OPEN-SOURCE SCRIPT
Supp_Ress_V1
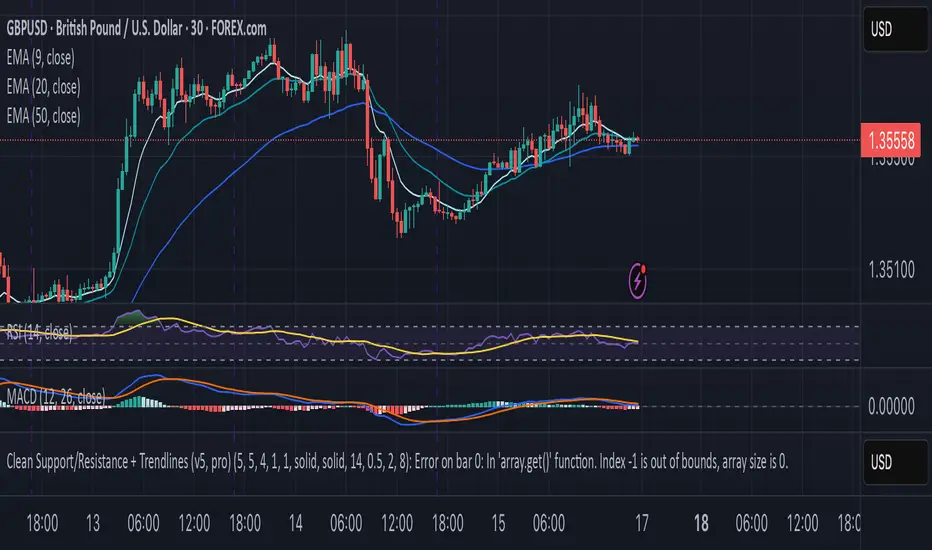
This indicator automatically plots support and resistance levels using confirmed pivot highs and lows, then manages them smartly by merging nearby levels, extending them, and removing them once price breaks through.
It also draws trendlines by connecting valid higher-lows (uptrend) or lower-highs (downtrend), ensuring they slope correctly and have enough spacing between pivots.
In short: it gives you a clean, trader-like map of the most relevant S/R zones and trendlines, updating dynamically as price action unfolds.
Скрипт с открытым кодом
В истинном духе TradingView, создатель этого скрипта сделал его открытым исходным кодом, чтобы трейдеры могли проверить и убедиться в его функциональности. Браво автору! Вы можете использовать его бесплатно, но помните, что перепубликация кода подчиняется нашим Правилам поведения.
Отказ от ответственности
Информация и публикации не предназначены для предоставления и не являются финансовыми, инвестиционными, торговыми или другими видами советов или рекомендаций, предоставленных или одобренных TradingView. Подробнее читайте в Условиях использования.