OPEN-SOURCE SCRIPT
Обновлено PEV Price Band
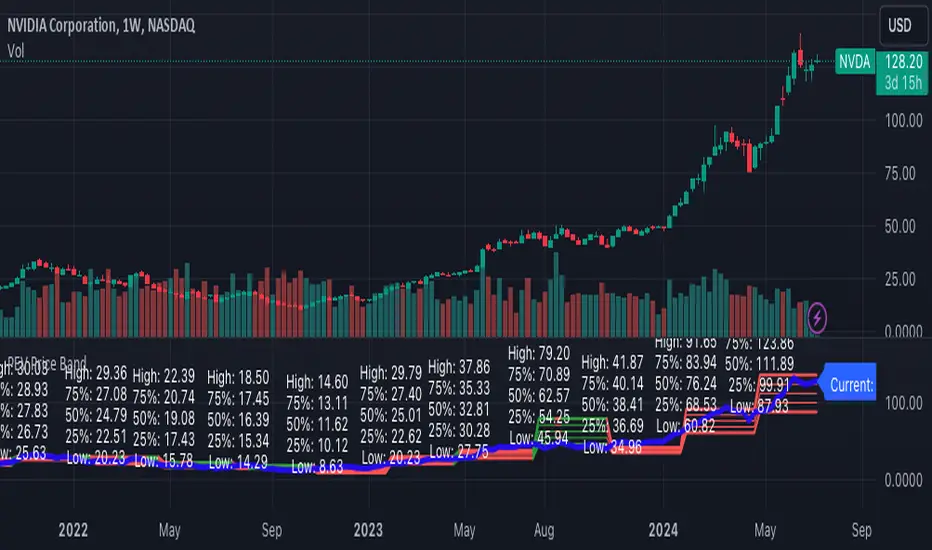
The PEV Price Band shows prices calculated using the high and low P/FQ EV of the previous period. (price to enterprise value per share for the last quarter) multiplied by FQ's current EVPS (similar to comparing marketcap to enterprise value but edit equations that are close to the theory of P/E)
If the current price is lower than the minimum P/EVPS, it is considered cheap. In other words, a current price is above the maximum is considered expensive.
PEV Price Band consists of 2 parts.
- First of all, the current P/EVPS value is "green" (if the markecap is less than the enterprise value) or "red" (if the marketcap is more than the enterprise value) or "gold" (if the market value is less than the enterprise value and less than equity)
- Second, the blue line is the closing price.
Информация о релизе
1. Fixed bug in 5000 bars in day timeframe- Added attribute "calc_bars_count = 5000" in indicator
2. Changed "TOTAL_SHARES_OUTSTANDING" to "DILUTED_SHARES_OUTSTANDING"
3. Changed condition from checking uptrend condition to current price less than enterprise value for easy understanding
Скрипт с открытым кодом
В истинном духе TradingView, создатель этого скрипта сделал его открытым исходным кодом, чтобы трейдеры могли проверить и убедиться в его функциональности. Браво автору! Вы можете использовать его бесплатно, но помните, что перепубликация кода подчиняется нашим Правилам поведения.
Отказ от ответственности
Информация и публикации не предназначены для предоставления и не являются финансовыми, инвестиционными, торговыми или другими видами советов или рекомендаций, предоставленных или одобренных TradingView. Подробнее читайте в Условиях использования.