OPEN-SOURCE SCRIPT
Обновлено Normalized Dist from 4H MA200 + Chart Highlights
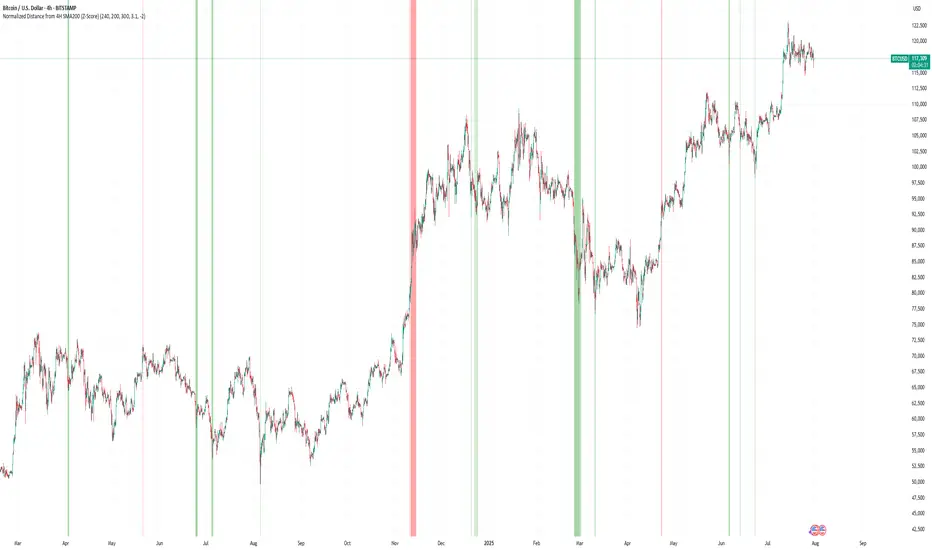
Normalized Distance from 4H EMA200 + Highlighting Extremes
This indicator measures the distance between the current price and the 4-hour EMA200, normalized into a z-score to detect statistically significant deviations.
🔹 The lower pane shows the normalized z-score.
🔹 Green background = price far below EMA200 (z < -2).
🔹 Red background = price far above EMA200 (z > 3.1).
🔹 These thresholds are user-configurable.
🔹 On the main chart:
🟥 Red candles indicate overheated prices (z > upper threshold)
🟩 Green candles signal oversold conditions (z < lower threshold)
The EMA200 is always taken from a fixed 4H timeframe, regardless of your current chart resolution.
Информация о релизе
Normalized Distance from 4H EMA200 + Highlighting ExtremesThis indicator measures the distance between the current price and the 4-hour EMA200, normalized into a z-score to detect statistically significant deviations.
🔹 The lower pane shows the normalized z-score.
🔹 Green background = price far below EMA200 (z < -2).
🔹 Red background = price far above EMA200 (z > 3.1).
🔹 These thresholds are user-configurable.
🔹 On the main chart:
🟥 Red candles indicate overheated prices (z > upper threshold)
🟩 Green candles signal oversold conditions (z < lower threshold)
The EMA200 is always taken from a fixed 4H timeframe, regardless of your current chart resolution.
Скрипт с открытым кодом
В истинном духе TradingView, создатель этого скрипта сделал его открытым исходным кодом, чтобы трейдеры могли проверить и убедиться в его функциональности. Браво автору! Вы можете использовать его бесплатно, но помните, что перепубликация кода подчиняется нашим Правилам поведения.
Отказ от ответственности
Информация и публикации не предназначены для предоставления и не являются финансовыми, инвестиционными, торговыми или другими видами советов или рекомендаций, предоставленных или одобренных TradingView. Подробнее читайте в Условиях использования.