PINE LIBRARY
OfficalQLBacktestingMetrics
Library "OfficalQLBacktestingMetrics"
TODO: credits to elicobra and bikelife76
curve(disp_ind)
Call function to get a certain curve of your strategy.
Parameters:
disp_ind (string)
Returns: Returns type of curve plot.
quantlapseTable(option, position)
Assign this function to a random variable to get the "Performance Table"
Parameters:
option (simple string)
position (simple string)
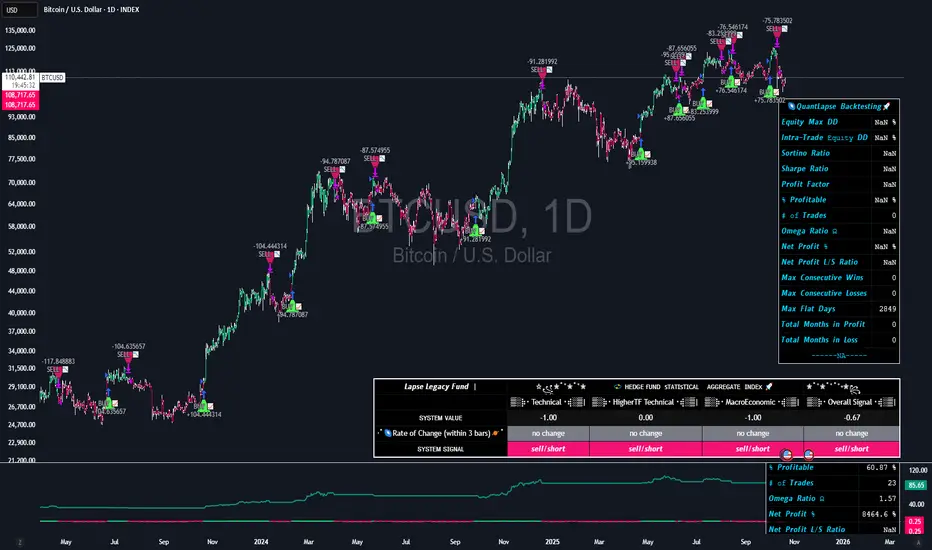
OfficialQLBacktestingMetrics is a comprehensive backtesting metrics and visualization library for Pine Script v6.
It provides an advanced set of quantitative performance tools to evaluate and visualize the robustness of any TradingView strategy. Designed for precision and clarity, this library calculates key trading metrics, generates visual performance tables, and applies dynamic color grading to highlight strengths and weaknesses across critical performance dimensions.
🔍 Key Features
Comprehensive Statistical Engine:
Calculates advanced metrics including Sharpe Ratio, Sortino Ratio, Omega Ratio, Profit Factor, Max Equity Drawdown, Intra-Trade Drawdown, Win/Loss consistency, Long/Short profit ratios, and more.
Visual Performance Table:
The quantlapseTable() function creates a fully customizable performance dashboard directly on your chart. Choose between:
Full — displays all available statistics.
Simple — compact view of key performance metrics.
None — hides the table when not needed.
Dynamic Color Grading:
Metrics are visually ranked through gradient color logic to help quickly identify strong vs weak areas in strategy performance.
Curve and Filtering Utilities:
Use curve() and cleaner() to easily access and manage equity curves, profit data, and strategy-specific plots for further analysis or visualization.
Smart Statistical Adjustments:
The library automatically scales statistical measures such as Sharpe and Sortino ratios according to the chart’s timeframe, ensuring accurate normalization across daily, weekly, or intraday data.
Robustness Scoring System (“Slap Score”):
A built-in performance quality evaluator that scores a strategy’s overall robustness based on multiple key performance thresholds.
🧩 Main Functions
Function Description
curve(disp_ind) Returns selected equity or profit curve.
cleaner(disp_ind, plot) Filters plots to show only selected display types.
stat_calc() Core metric computation engine. Returns all major backtesting stats.
quantlapseTable(option, position) Generates performance table (Full, Simple, or None).
f_colors(metric, value) Assigns gradient colors to metrics for visual evaluation.
maxEquityDrawDown() / maxTradeDrawDown() Calculates drawdowns at equity and trade levels.
consecutive_wins() / consecutive_losses() Measures streaks of profitable/unprofitable trades.
long_profit() / short_profit() Evaluates long/short side profitability ratios.
⚙️ Usage Example
//version=6
import QuantLapse/OfficalQLBacktestingMetrics/1 as ql
disp_ind = input.string ("Equity" , title = "Display Curve" , tooltip = "Choose which data you would like to display", options=["Strategy", "Equity", "Open Profit", "Gross Profit", "Net Profit", "None"], group = "🌌𝙌𝙪𝙖𝙣𝙩𝙇𝙖𝙥𝙨𝙚 𝘽𝙖𝙘𝙠𝙩𝙚𝙨𝙩𝙞𝙣𝙜🚀")
pos_table = input.string("Middle Right", "Table Position", options = ["Top Left", "Middle Left", "Bottom Left", "Top Right", "Middle Right", "Bottom Right", "Top Center", "Bottom Center"], group = "🌌𝙌𝙪𝙖𝙣𝙩𝙇𝙖𝙥𝙨𝙚 𝘽𝙖𝙘𝙠𝙩𝙚𝙨𝙩𝙞𝙣𝙜🚀")
type_table = input.string("Full", "Table Type", options = ["Full", "Simple", "None"], group = "🌌𝙌𝙪𝙖𝙣𝙩𝙇𝙖𝙥𝙨𝙚 𝘽𝙖𝙘𝙠𝙩𝙚𝙨𝙩𝙞𝙣𝙜🚀")
ql.quantlapseTable("Full", "Top Right")
plot(ql.curve(disp_ind), color = color.teal, linewidth = 2)
ql.quantlapseTable(type_table, pos_table)
🧠 Credits
Created by elicobra and bikelife76 tweaked my QuantLapse
TODO: credits to elicobra and bikelife76
curve(disp_ind)
Call function to get a certain curve of your strategy.
Parameters:
disp_ind (string)
Returns: Returns type of curve plot.
quantlapseTable(option, position)
Assign this function to a random variable to get the "Performance Table"
Parameters:
option (simple string)
position (simple string)
OfficialQLBacktestingMetrics is a comprehensive backtesting metrics and visualization library for Pine Script v6.
It provides an advanced set of quantitative performance tools to evaluate and visualize the robustness of any TradingView strategy. Designed for precision and clarity, this library calculates key trading metrics, generates visual performance tables, and applies dynamic color grading to highlight strengths and weaknesses across critical performance dimensions.
🔍 Key Features
Comprehensive Statistical Engine:
Calculates advanced metrics including Sharpe Ratio, Sortino Ratio, Omega Ratio, Profit Factor, Max Equity Drawdown, Intra-Trade Drawdown, Win/Loss consistency, Long/Short profit ratios, and more.
Visual Performance Table:
The quantlapseTable() function creates a fully customizable performance dashboard directly on your chart. Choose between:
Full — displays all available statistics.
Simple — compact view of key performance metrics.
None — hides the table when not needed.
Dynamic Color Grading:
Metrics are visually ranked through gradient color logic to help quickly identify strong vs weak areas in strategy performance.
Curve and Filtering Utilities:
Use curve() and cleaner() to easily access and manage equity curves, profit data, and strategy-specific plots for further analysis or visualization.
Smart Statistical Adjustments:
The library automatically scales statistical measures such as Sharpe and Sortino ratios according to the chart’s timeframe, ensuring accurate normalization across daily, weekly, or intraday data.
Robustness Scoring System (“Slap Score”):
A built-in performance quality evaluator that scores a strategy’s overall robustness based on multiple key performance thresholds.
🧩 Main Functions
Function Description
curve(disp_ind) Returns selected equity or profit curve.
cleaner(disp_ind, plot) Filters plots to show only selected display types.
stat_calc() Core metric computation engine. Returns all major backtesting stats.
quantlapseTable(option, position) Generates performance table (Full, Simple, or None).
f_colors(metric, value) Assigns gradient colors to metrics for visual evaluation.
maxEquityDrawDown() / maxTradeDrawDown() Calculates drawdowns at equity and trade levels.
consecutive_wins() / consecutive_losses() Measures streaks of profitable/unprofitable trades.
long_profit() / short_profit() Evaluates long/short side profitability ratios.
⚙️ Usage Example
//version=6
import QuantLapse/OfficalQLBacktestingMetrics/1 as ql
disp_ind = input.string ("Equity" , title = "Display Curve" , tooltip = "Choose which data you would like to display", options=["Strategy", "Equity", "Open Profit", "Gross Profit", "Net Profit", "None"], group = "🌌𝙌𝙪𝙖𝙣𝙩𝙇𝙖𝙥𝙨𝙚 𝘽𝙖𝙘𝙠𝙩𝙚𝙨𝙩𝙞𝙣𝙜🚀")
pos_table = input.string("Middle Right", "Table Position", options = ["Top Left", "Middle Left", "Bottom Left", "Top Right", "Middle Right", "Bottom Right", "Top Center", "Bottom Center"], group = "🌌𝙌𝙪𝙖𝙣𝙩𝙇𝙖𝙥𝙨𝙚 𝘽𝙖𝙘𝙠𝙩𝙚𝙨𝙩𝙞𝙣𝙜🚀")
type_table = input.string("Full", "Table Type", options = ["Full", "Simple", "None"], group = "🌌𝙌𝙪𝙖𝙣𝙩𝙇𝙖𝙥𝙨𝙚 𝘽𝙖𝙘𝙠𝙩𝙚𝙨𝙩𝙞𝙣𝙜🚀")
ql.quantlapseTable("Full", "Top Right")
plot(ql.curve(disp_ind), color = color.teal, linewidth = 2)
ql.quantlapseTable(type_table, pos_table)
🧠 Credits
Created by elicobra and bikelife76 tweaked my QuantLapse
Библиотека Pine
В истинном духе TradingView автор опубликовал этот код Pine как библиотеку с открытым исходным кодом, чтобы другие программисты Pine из нашего сообщества могли им воспользоваться. Вы можете использовать эту библиотеку в приватных или других публикациях с открытым исходным кодом, но повторное использование этого кода в публикации регулируется Правилами поведения.
Отказ от ответственности
Все виды контента, которые вы можете увидеть на TradingView, не являются финансовыми, инвестиционными, торговыми или любыми другими рекомендациями. Мы не предоставляем советы по покупке и продаже активов. Подробнее — в Условиях использования TradingView.