PROTECTED SOURCE SCRIPT
CRT + Daily Bias - Milana Trades
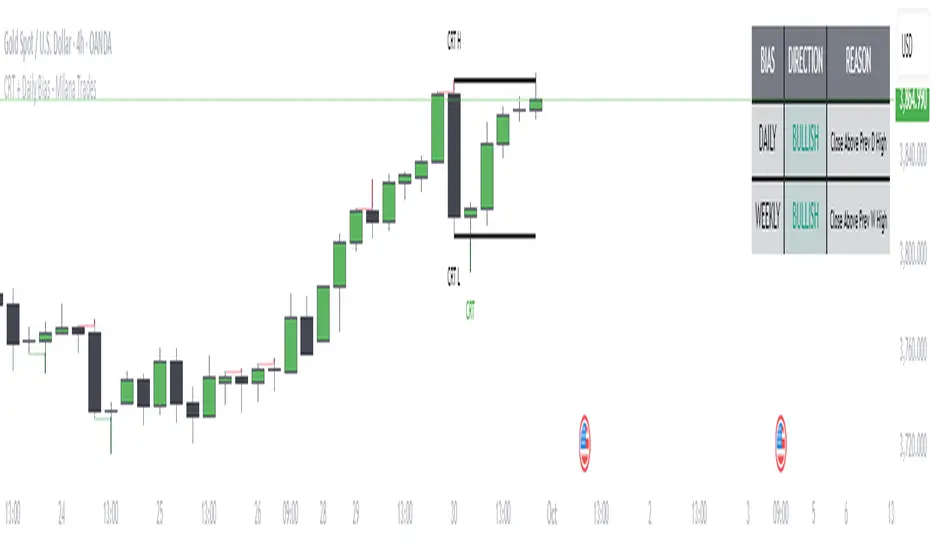
This indicator merges Candle Range Theory (CRT) with a Daily & Weekly Bias model, offering traders a complete view of both short-term price traps and higher-timeframe market direction. It is designed to highlight potential liquidity traps, reversals, and directional bias in a structured and visually intuitive format.
🔹 1. Candle Range Theory (CRT)
The CRT module detects false breakout candles (trap candles) and plots key high/low levels to mark significant turning points.
Bullish CRT
Occurs when price makes a lower low than the previous candle but closes bullish (close > open).
→ Suggests a possible upside reversal.
Bearish CRT
Occurs when price makes a higher high than the previous candle but closes bearish (close < open).
→ Suggests a possible downside reversal.
When a CRT is detected:
Dotted lines and levels are drawn from the trap candle’s high/low.
Labels such as CRT, CRT H, and CRT L appear for easy visualization.
Previous CRT structures can auto-clear when new traps form.
Alerts trigger once a trap is confirmed on candle close.
🔹 2. Daily & Weekly Bias
The Bias module determines market direction using daily and weekly candle structure. It evaluates:
Breaks above/below previous highs and lows.
Failed breaks (false moves beyond prior levels).
Inside bars (neutral range conditions).
Bias Logic Summary:
Close Above Previous High → Bullish
Close Below Previous Low → Bearish
Failed Break Above → Bearish
Failed Break Below → Bullish
Inside Range → Neutral
Both Daily and Weekly bias values are displayed in an on-chart table for quick context.
⚠️ Note:
The bias readings are technical references, not trading signals. Always combine them with your own analysis, context, and market awareness.
🔹 3. Bias Table
A clean table (top-right by default) displays:
Timeframe (Daily / Weekly)
Current Bias (Bullish, Bearish, Neutral)
Reason for bias (breakout, failure, or inside bar)
The table is fully customizable, allowing you to adjust:
Header and text colors
Background and border styles
Display of specific timeframes (Daily / Weekly)
🔹 4. Alerts
Real-time alerts notify you when:
Bullish CRT is detected
Bearish CRT is detected
Alerts only trigger on candle close for accuracy and reduced false signals.
🔹 5. Settings
CRT Module
Length: Number of bars CRT levels extend.
Clear Broken: Automatically removes old CRT levels when new traps form.
Trap Candle Colors: Customize bullish/bearish candle highlights.
Line & Label Style: Full control of label size, color, and line styling.
Bias Module
Show Table: Toggle on/off.
Show Daily / Weekly Bias: Select which to display.
Color Customization: Set colors for bias states and table design.
🔹 6. How to Use
Watch for CRT labels forming near major or liquidity areas.
Check the Daily/Weekly Bias Table for trend confirmation.
Align CRT signals with the bias direction for higher-probability setups.
Use alerts to stay informed without constantly monitoring charts.
Скрипт с защищённым кодом
Этот скрипт опубликован с закрытым исходным кодом. Однако вы можете использовать его свободно и без каких-либо ограничений — читайте подробнее здесь.
Отказ от ответственности
Все виды контента, которые вы можете увидеть на TradingView, не являются финансовыми, инвестиционными, торговыми или любыми другими рекомендациями. Мы не предоставляем советы по покупке и продаже активов. Подробнее — в Условиях использования TradingView.