Custom Time-Range Breakout with 4x EMA Filter Time-Range Breakout Monitor with 4x EMA FilterThis indicator is a powerful tool designed to capture volatility during specific market hours (like London or New York opens). It monitors a custom price range (High/Low) and tracks whether these levels are breached, using a 4x EMA ribbon as a trend filter.Key Features:Adjustable Range: Define your own start and end time (hours and minutes) to mark the session range.Breakout Tracking: The indicator visually tracks if the High or Low of the session has been taken (Broken) and displays the status in a real-time dashboard.4x EMA Ribbon: Integrated trend filter with specific color coding for quick visual confirmation.Smart Alerts: Built-in alerts for both Bullish (Up) and Bearish (Down) breakouts.EMA Color Legend (Rafał's Setup):EMA PeriodColorRoleEMA 20GrayShort-term momentumEMA 50GreenMedium-term trend confirmationEMA 100YellowIntermediate support/resistanceEMA 200RedLong-term baseline (The "Trendline")How to Use:Set the Session: Input your target range in the settings (e.g., 09:00 - 10:00).Monitor the Dashboard: The top-right table shows "TAK" (YES) or "NIE" (NO) if the levels have been breached during the current day.Confirm the Trend: * Long: Price breaks above the range AND is supported by the Green (50) and Red (200) EMAs.Short: Price breaks below the range AND is trending under the Green (50) and Red (200) EMAs.Settings:Start/End Hour & Minute: Full control over the tracked time window.Alerts: Enable "Wybicie Górą" or "Wybicie Dołem" in the TradingView Alert menu.
1-hour

Alternate Hourly HighlightAlternate Hourly Highlight
This indicator automatically highlights every alternate one-hour window on your chart, making it easy to visually identify and separate each trading hour. The background alternates color every hour, helping traders spot hourly cycles, session changes, or develop time-based trading strategies.
Works on any timeframe.
No inputs required—just add to your chart and go!
Especially useful for intraday traders who analyze price action, volatility, or volume by the hour.
For custom colors or session windows, feel free to modify the script!

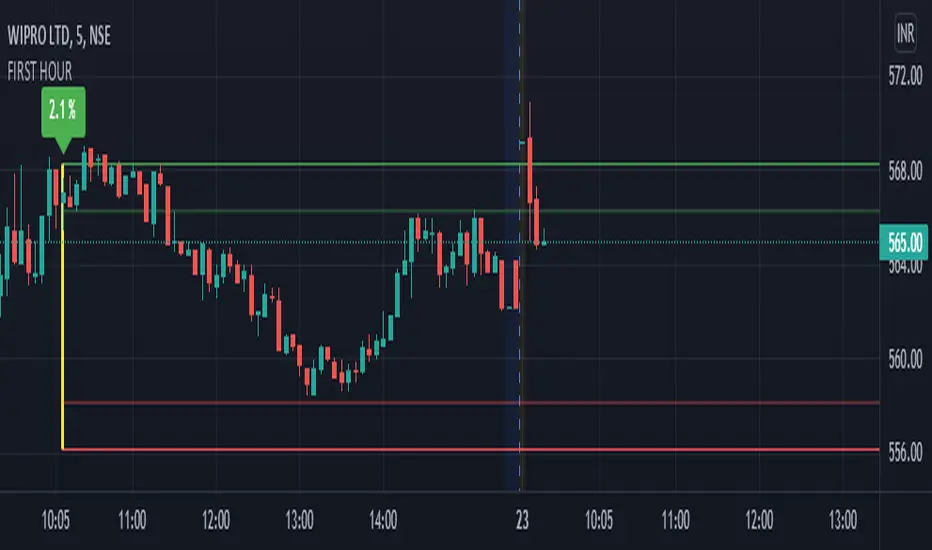
first hour high and low by akash mauryaThis indicator marks the first hour's high and low with a line with the percentage of range height.
First hour high and low generally act as heavy support and resistance or say major key areas in daily intraday charts.
You can adjust the settings if you want to see previous days' hour range lines or not.
This indicator will automatically create hour-range lines after an hour of market opening.
RexDog Hour Close LinesThe RexDog Hour Close Lines plots the last 4 previous hour (60 minute) closes. Extremely helpful indicator for traders who trade on lower timeframes below the 60.
The plotted lines are also offset to represent that hours close location on the chart-- but keep the below in mind.
The offset is set for a default resolution of 5 minutes. In that chart timeframe, the offset is correct as to the close location. Changing the timeframe to 3m for instance the offset is not accurate to that particular bar. I am sure there is a simple way to do this but maybe I'm just not smart enough to figure it out. Either way, the offset in any timeframe is easy to distinguish the oldest hour close to the newest.
This indicator has the following options:
You can enable or disable any previous 4 hour close line
You can change all line sizes
You can change all line colors. I do apologize if it's inconvenient that I've defaulted the lines to different colors.
I've limited the visibility to only periods below 60 minutes-- but and maybe there is a better way to do this (if so please share). The limit is based on the most common periods below 60: 1, 2, 3, 5, 10, 12, 15, and 30.
Will most likely release the 240 and 30-minute version of this I have on a few charts.

Show ATR and 1st hour high+low1. Shows TR at daily bars
2. Shows ATR lines intraday: 100% and 75% (customizable)
3. Shows hint with ATR for current day and percent passed
4. Show high and low of the 1st hour

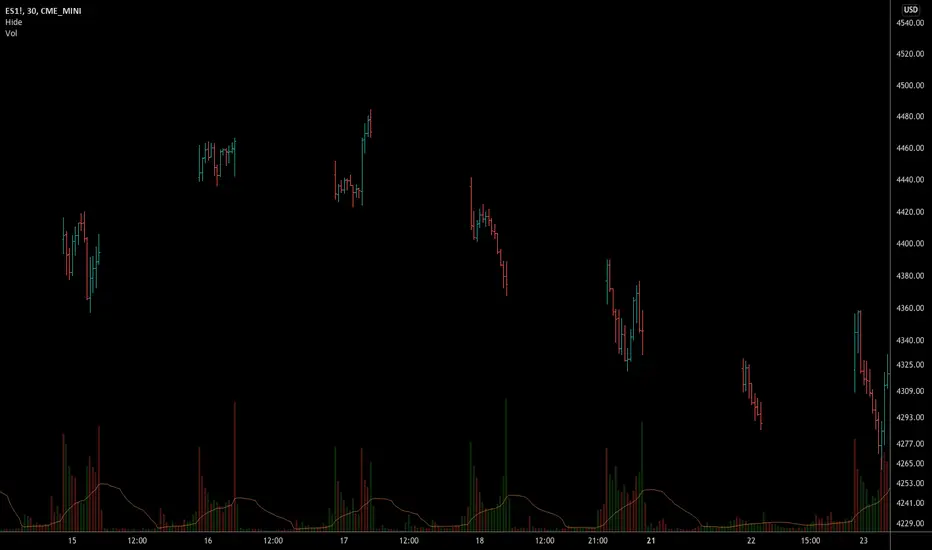
Hide extended hours/non-intraday barsEspecially for future users, such as ES/NQ/RTY/YM, etc., this script can hide the extended hours/non-intraday bars and leave the intraday bars only.
With this script , you can find the intraday support/resistance quite easily!
Example, if you are a ES investor, you can easily find the intraday support/resistance level ,which is almost equal to SPY, with this script, and no need to check SPY separately again , saving your time a lot.
Note: Please couple this script with American Bars. If you use candle charts, the upper/lower pins of the candle can't be hidden with the bars together, which is restricted by the code editor itself...