Market Sentiment Trend Gauge [LevelUp]Market Sentiment Trend Gauge simplifies technical analysis by mathematically combining momentum, trend direction, volatility position, and comparison against a market benchmark, into a single trend score from -100 to +100. Displayed in a separate pane below your chart, it resolves conflicting signals from RSI, moving averages, Bollinger Bands, and market correlations, providing clear insights into trend direction, strength, and relative performance.
THE PROBLEM MARKET SENTIMENT TREND GAUGE (MSTG) SOLVES
Traditional indicators often produce conflicting signals, such as RSI showing overbought while prices rise or moving averages indicating an uptrend despite market underperformance. MSTG creates a weighted composite score to answer: "What's the overall bias for this asset?"
KEY COMPONENTS AND WEIGHTINGS
The trend score combines
▪ Momentum (25%): Normalized 14-period RSI, capped at ±100.
▪ Trend Direction (35%): 10/21-period EMA relationships,
▪ Volatility Position (20%): Price position, 20-period Bollinger Bands, capped at ±100.
▪ Market Comparison (20%): Daily performance vs. SPY benchmark, capped at ±100.
Final score = Weighted sum, smoothed with 5-period EMA.
INTERPRETING THE MSTG CHART
Trend Score Ranges and Colors
▪ Bright Green (>+30): Strong bullish; ideal for long entries.
▪ Light Green (+10 to +30): Weak bullish; cautiously favorable.
▪ Gray (-10 to +10): Neutral; avoid directional trades.
▪ Light Red (-10 to -30): Weak bearish; exercise caution.
▪ Bright Red (<-30): Strong bearish; high-risk for longs, consider shorts.
Reference Lines
▪ Zero Line (Gray): Separates bullish/bearish; crossovers signal trend changes.
▪ ±30 Lines (Dotted, Green/Red): Thresholds for strong trends.
▪ ±60 Lines (Dashed, Green/Red): Extreme strength zones (not overbought/oversold); manage risk (tighten stops, partial profits) but trends may persist.
Background Colors
▪ Green Tint (>+20): Bullish environment; favorable for longs.
▪ Red Tint (<-20): Bearish environment; caution for longs.
▪ Light Gray Tint (-20 to +20): Neutral/range-bound; wait for signals.
Extreme Readings vs. Traditional Signals
MSTG ±60 indicates maximum alignment of all factors, not reversals (unlike RSI >70/<30). Use for risk management, not automatic exits. Strong trends can sustain extremes; breakdowns occur below +30 or above -30.
INFORMATION TABLE INTERPRETATION
Trend Score Symbols
▲▲ >+30 strong bullish
▲ +10 to +30
● -10 to +10 neutral
▼ -30 to -10
▼▼ <-30 strong bearish
Colors: Green (positive), White (neutral), Red (negative).
Momentum Score
+40 to +100 strong bullish
0 to +40 moderate bullish
-40 to 0 moderate bearish
-100 to -40 strong bearish
Market vs. Stock
▪ Green: Stock outperforming market
▪ Red: Stock underperforming market
Example Interpretations:
-0.45% / +1.23% (Green): Market down, stock up = Strong relative strength
+2.10% / +1.50% (Red): Both rising, but stock lagging = Relative weakness
-1.20% / -0.80% (Green): Both falling, but stock declining less = Defensive strength
UNDERSTANDING EXTREME READINGS VS TRADITIONAL OVERBOUGHT/OVERSOLD
⚠️ Critical distinctions
Traditional Overbought/Oversold Signals:
▪ Single indicator (like RSI >70 or <30) showing momentum excess
▪ Often suggests immediate reversal or pullback expected
▪ Based on "price moved too far, too fast" concept
MSTG Extreme Readings (±60):
▪ Composite alignment of 4 different factors (momentum, trend, volatility, relative strength)
▪ Indicates maximum strength in current direction
▪ NOT a reversal signal - means "all systems extremely bullish/bearish"
Key Differences:
▪ RSI >70: "Price got ahead of itself, expect pullback"
▪ MSTG >+60: "Everything is extremely bullish right now"
▪ Strong trends can maintain extreme MSTG readings during major moves
▪ Breakdowns happen when MSTG falls below +30, not at +60
Proper Usage of Extreme Readings:
▪ Risk Management: Tighten stops, take partial profits
▪ Position Sizing: Reduce new position sizes at extremes
▪ Trend Continuation: Watch for sustained extreme readings in strong markets
▪ Exit Signals: Look for breakdown below +30, not reversal from +60
TRADING WITH MSTG
Quick Assessment
1. Check trend symbol for direction.
2. Confirm momentum strength.
3. Note relative performance color.
Examples:
▲▲ 55.2 (Green), Momentum +28.4, Outperforming: Strong buy setup.
▼ -18.6 (Red), Momentum -43.2, Underperforming: Defensive positioning.
Entry Conditions
▪ Long: stock outperforming market
- Score >+30 (bright green)
- Sustained green background
- ▲▲ symbol,
▪ Short: stock underperforming market
- Score <-30 (bright red)
- Sustained red background
- ▼▼ symbol
Avoid Trading When:
▪ Gray zone (-10 to +10).
▪ Rapid color changes or frequent zero-line crosses (choppy market).
▪ Gray background (range-bound).
Risk Management:
▪ Stop Loss: Exit on zero-line crossover against position.
▪ Take Profit: Partial at ±60 for risk control.
▪ Position Sizing: Larger when signals align; smaller in extremes or mixed conditions.
KEY ADVANTAGES
▪ Unified View: Weighted composite reduces noise and conflicts.
▪ Visual Clarity: 5-color system with gradients for rapid recognition.
▪ Market Context: Relative strength vs. SPY identifies leaders/laggards.
▪ Flexibility: Works across timeframes (1-min to weekly); customizable table.
▪ Noise Reduction: EMA smoothing minimizes false signals.
EXAMPLES
Strong Bull: Trend Score 71.9, Momentum Score 76.9
Neutral: Trend Score 0.1, Momentum Score -9.2
Strong Bear: Trend Score -51.7, Momentum Score -51.5
PERFORMANCE AND LIMITATIONS
Strengths: Trend identification, noise reduction, relative performance versus market.
Limitations: Lags at turning points, less effective in extreme volatility or non-trending markets.
Recommendations: View on multiple timeframes, combine with price action and fundamentals.
Индикаторы и стратегии

Predicted Funding RatesOverview
The Predicted Funding Rates indicator calculates real-time funding rate estimates for perpetual futures contracts on Binance. It uses triangular weighting algorithms on multiple different timeframes to ensure an accurate prediction.
Funding rates are periodic payments between long and short position holders in perpetual futures markets
If positive, longs pay shorts (usually bullish)
If negative, shorts pay longs (usually bearish)
This is a prediction. Actual funding rates depend on the instantaneous premium index, derived from bid/ask impacts of futures. So whilst it may imitate it similarly, it won't be completely accurate.
This only applies currently to Binance funding rates, as HyperLiquid premium data isn't available. Other Exchanges may be added if their premium data is uploaded.
Methods
Method 1: Collects premium 1-minunute data using triangular weighing over 8 hours. This granular method fills in predicted funding for 4h and less recent data
Method 2: Multi-time frame approach. Daily uses 1 hour data in the calculation, 4h + timeframes use 15M data. This dynamic method fills in higher timeframes and parts where there's unavailable premium data on the 1min.
How it works
1) Premium data is collected across multiple timeframes (depending on the timeframe)
2) Triangular weighing is applied to emphasize recent data points linearly
Tri_Weighing = (data *1 + data *2 + data *3 + data *4) / (1+2+3+4)
3) Finally, the funding rate is calculated
FundingRate = Premium + clamp(interest rate - Premium, -0.05, 0.05)
where the interest rate is 0.01% as per Binance
Triangular weighting is calculated on collected premium data, where recent data receives progressively higher weight (1, 2, 3, 4...). This linear weighting scheme provides responsiveness to recent market conditions while maintaining stability, similar to an exponential moving average but with predictable, linear characteristics
A visual representation:
Data points: ──────────────>
Weights: 1 2 3 4 5
Importance: ▂ ▃ ▅ ▆ █
How to use it
For futures traders:
If funding is trending up, the market can be interpreted as being in a bull market
If trending down, the market can be interpreted as being in a bear market
Even used simply, it allows you to gauge roughly how well the market is performing per funding. It can basically be gauged as a sentiment indicator too
For funding rate traders:
If funding is up, it can indicate a long on implied APR values
If funding is down, it can indicate a short on implied APR values
It also includes an underlying APR, which is the annualized funding rate. For Binance, it is current funding * (24/8) * 365
For Position Traders: Monitor predicted funding rates before entering large positions. Extremely high positive rates (>0.05% for 8-hour periods) suggest overleveraged longs and potential reversal risk. Conversely, extreme negative rates indicate shorts dominance
Table:
Funding rate: Gives the predicted funding rate as a percentage
Current premium: Displays the current premium (difference between perpetual futures price and the underlying spot) as a percentage
Funding period: You can choose between 1 hour funding (HyperLiquid usually) and 8 hour funding (Binance)
APR: Underlying annualized funding rate
What makes it original
Whilst some predicted funding scripts exist, some aren't as accurate or have gaps in data. And seeing as funding values are generally missing from TV tickers, this gives traders accessibility to the script when they would have to use other platforms
Notes
Currently only compatible with symbols that have Binance USDT premium indices
Optimal accuracy is found on timeframes that are 4H or less. On higher timeframes, the accuracy drops off
Actual funding rates may differ
Inputs
Funding Period: Choose between "8 Hour" (standard Binance cycle) or "1 Hour" (divides the 8-hour rate by 8 for granular comparison)
Plot Type: Display as "Funding Rate" (percentage per interval) or "APR" (annualized rate calculated as 8-hour rate × 3 × 365)
Table: Toggle the information table showing current funding rate, premium, funding period, and APR in the top-right corner
Positive Colour: Sets the colour for positive funding rates where longs pay shorts (default: #00ffbb turquoise)
Negative Colour: Sets the colour for negative funding rates where shorts pay longs (default: red)
Table Background: Controls the background colour and transparency of the information table (default: transparent dark blue)
Table Text Colour: Sets the colour for all text labels in the information table (default: white)
Table Text Size: Controls font size with options from Tiny to Huge, with Small as the default balance of readability and space

CNagda-MomentumX - Institutional FlowMomentumX is designed to empower traders with a deeper understanding of market movements by focusing on Institutional Flow and advanced market structure analytics. The core goal is to identify and visualize where major market participants are operating, and to translate these complex footprints into clear, actionable trading signals — all in real time.
Real-time institutional activity mapping
Actionable entry and exit signals based on live market structure
Intuitive dashboard and dynamic chart visuals
Fully customizable modules for trend, liquidity, and order blocks
Core Logic Design
At the heart of MomentumX lies a robust algorithmic engine built to capture and surface institutional trading behavior. By leveraging advanced mathematical models, the indicator calculates institutional volume ratios and price momentum to pinpoint aggressive moves from large participants.
Institutional Volume & Price Momentum:
Utilizes custom volume indicators and price change analysis to detect strong buying or selling pressure, filtering out retail noise.
Liquidity Grab Detection & Activity Zones:
The script identifies liquidity grabs by monitoring abrupt price sweeps at major support/resistance levels—often where institutions trigger stop hunts or reversals. All critical activity zones are automatically color-coded on the chart for instant recognition.
Dashboard Visualization:
A fully dynamic dashboard table overlays live scores for accumulation, distribution, strength, and weakness—giving traders a real-time scan of market health.
Trendline & Order Block Architecture:
The logic auto-detects pivot highs/lows to draw smart trendlines, while the order block system highlights key reversal areas and breaker zones—making market structure clear and actionable.
MomentumX is packed with high-performance modules, each engineered to simplify complex market behavior and enhance decision-making for traders:
Institutional Flow Signals:
Instantly identifies spots where institutional players drive momentum, using unique volume and price activity analytics.
Bullish/Bearish Liquidity Grab Detection:
Marks abrupt price moves that signal stop hunts or reversals, letting traders anticipate snap-backs or trend shifts.
Trendline Auto-Detection:
Smartly draws trendlines based on significant swing highs and lows, automatically adjusting as price evolves.
Order Block System (Rejection/Breaker):
Spots and highlights key reversal zones with order block rectangles, confirming rejections or breakouts at strategic levels.
Dashboard and Bar Coloring:
A clean dashboard overlay presents live market scores, while dynamic bar coloring makes trend, strength, and high-activity periods instantly visible.
User Input Toggles for Each Module:
Every major feature is fully customizable—enable or disable modules to match individual trading setups or preferences.
Scripting/Development
MomentumX’s scripting process is modular, enabling clarity, scalability, and fast optimization throughout development:
Initialization & Inputs:
Start by defining all user input options, module toggles, color settings, and calculation parameters—ensuring maximum flexibility early on.
Core Calculation Functions:
Script advanced institutional volume and price momentum algorithms. Build out swing length logic, market state filters, and activity scoring methods.
Detection Engines:
Develop and integrate engines for liquidity grabs, automated trendline detection, and order block identification—each with dedicated functions for speed and precision.
Visual Overlays & Plotting:
Implement powerful plotting logic for colored bars, score dashboards, trendlines, reversal zones, and liquidity markers—making every data point clear and actionable on the chart.
Testing Handlers:
Add diagnostic panels and debug outputs to refine calculations and assure accuracy in every market environment.
Sample Trade Setups (Usage)
Cnagda MomentumX delivers clarity for multiple trading styles by providing timely, actionable setups grounded in institutional behavior and market structure. Here’s how traders can leverage the indicator for confident decision-making:
Liquidity Grab Reversal
Enter trades around detected liquidity grabs when price sweeps major support/resistance and the dashboard signals a momentum shift.
Example: Wait for a bullish/Bearish grab near market lows/high, with institutional flow turning positive/negative—enter long/short for potential mean reversion.
Order Block Breakout
Trade breakouts when price cleanly rejects or flips key order block zones highlighted on the chart.
Example: Short at a marked breaker block after a rejection signal, confirmed by a downward institutional activity spike.
Trendline Continuation
Ride established market moves by entering on trendline confirmations plotted by the auto-detect system.
Example: Go long after a trendline retest, confirmed by a green bar color and dashboard strength score.
Dashboard Confirmation
Combine dashboard metrics (strength, accumulation, distribution) with bar color overlays for multi-factor entries.
Example: Enter trades only when all market signals align in real time for maximum probability.
For Short Entry check -- Weakness : For Long Entry Check - Strength With Other Indications
MomentumX is not just another indicator – it’s your edge for reading the market like an insider. By transparently mapping institutional flow, uncovering hidden liquidity zones, and color-coding every major structure shift, MomentumX transforms complexity into actionable clarity. Whether you’re scalping, swing trading, or investing, you’ll gain a decisive, real-time advantage on every chart.
Embrace smarter decisions, adapt to changing market conditions instantly, and join a new generation of technically empowered traders.
Customize, observe, and let the market reveal opportunities in a way you’ve never experienced before.
Happy Trading

Dynamic Volume Trace Profile [ChartPrime]⯁ OVERVIEW
Dynamic Volume Trace Profile is a reimagined take on volume profile analysis. Instead of plotting a static horizontal histogram on the side of your chart, this indicator projects dynamic volume trace lines directly onto the price action. Each bin is color-graded according to its relative strength, creating a living “volume skeleton” of the market. The orange trace highlights the current Point of Control (POC)—the price level with maximum historical traded volume within the lookback window. On the right side, the tool builds a mini profile, showing absolute volume per bin alongside its percentage share, where the POC always represents 100% strength .
⯁ KEY FEATURES
Dynamic On-Chart Bins:
The range between highest high and lowest low is split into 25 bins. Each bin is drawn as a horizontal trace line across the lookback chart period.
Gradient Color Encoding:
Trace lines fade from transparent to teal depending on relative volume size. The more intense the teal, the stronger the historical traded activity at that level.
Automatic POC Highlight:
The bin with the highest aggregated volume is flagged with an orange line . This POC adapts bar-by-bar as volume distribution shifts.
Right-Side Volume Profile:
At the chart’s right edge, the script prints a box-style profile. Each bin shows:
• Total volume (absolute units).
• Percentage of max volume, in parentheses (POC bin = 100%).
This gives both raw and normalized context at a glance.
Adjustable Lookback Window:
The lookback defines how many bars feed the profile. Increase for stable HTF zones or decrease for responsive intraday distributions.
POC Toggle & Styling:
Optionally toggle POC highlighting on/off, adjust colors, and set line thickness for better integration with your chart theme.
⯁ HOW IT WORKS (UNDER THE HOOD)
Step Sizing:
over last 100 bars is divided by to calculate bin height.
Volume Aggregation:
For each bar in the , the script checks which bin the close falls into, then adds that bar’s volume to the bin’s counter.
Gradient Mapping:
Bin volume is normalized against the max volume across all bins. That value is mapped onto a gradient from transparent → teal.
POC Logic:
The bin with highest volume is colored orange both on the dynamic trace and in the right-side profile.
Right-Hand Profile:
Boxes are drawn for each bin proportional to volume / maxVolume × 50 units, with text labels showing both absolute volume and normalized %.
⯁ USAGE
Use the orange trace as the dominant “magnet” level—price often gravitates to the POC.
Watch for clusters of strong teal traces as areas of high acceptance; thin or faint zones mark low-liquidity gaps prone to fast moves.
On intraday charts, tighten lookback to reveal session-based distributions . For swing or position trading, expand lookback to surface more durable volume shelves.
Compare the right-side profile % to judge how “top-heavy” or “bottom-heavy” the current distribution is.
Use bright, intense color traces as context for confluence with structure, OBs, or liquidity hunts.
⯁ CONCLUSION
Dynamic Volume Trace Profile takes the traditional volume profile and fuses it into the body of price itself. Instead of a fixed sidebar, you see gradient traces layered directly on the chart, giving real-time context of where volume concentrated and where price may be drawn. With built-in POC highlighting, normalized % readouts, and an adaptive right-side profile, it offers both precision levels and market structure awareness in a cleaner, more intuitive form.

Integrated Rally + Price % Change DashboardUpdate: Integrated Rally & Price % Change Dashboard 📊
What’s New:
Rally Status added to alerts: Now, every price change alert also shows whether the rally is Getting Stronger or Weakening.
Maintains existing features: Price % Change, OBV trend with % change, ADX value, and Rally Strength visualized in a configurable dashboard.
Fully configurable font size, vertical/horizontal layout, and dashboard position.
Immediate, actionable alerts for intraday traders.
Change Log:
Added rally status to price change alerts for better context on momentum.

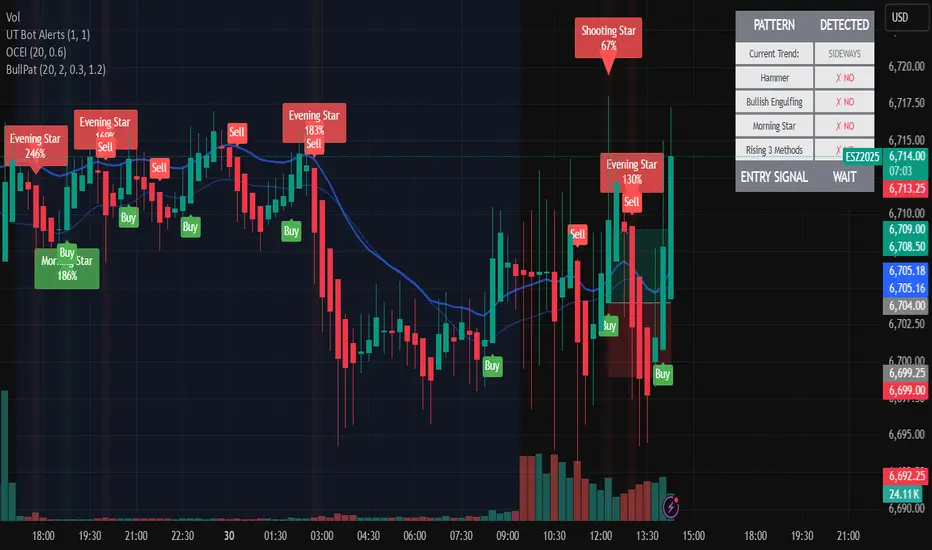
Bullish Candlestick PatternsBULLISH REVERSAL PATTERNS (in downtrends):
🔨 HAMMER
Small body at top of candle
Long lower wick (2x+ body size)
Little/no upper wick
Appears in downtrend
Signal: Sellers pushed down but buyers regained control
📈 BULLISH ENGULFING
Current green candle completely engulfs previous red candle
Larger body than previous candle (1.2x+)
Appears in downtrend
Signal: Strong buyer takeover from sellers
⭐ MORNING STAR (3-candle pattern)
Long red candle → Small body (indecision) → Long green candle
Green candle closes above midpoint of first red candle
Appears in downtrend
Signal: Powerful reversal confirmation
BULLISH CONTINUATION PATTERN (in uptrends):
📊 RISING THREE METHODS (5-candle pattern)
Strong green candle → 3 small red pullbacks → Breakout green candle
Pullbacks stay within range of first candle
Final candle breaks above
Appears in uptrend
Signal: Healthy consolidation before continuation
🎯 KEY FEATURES:
Pattern-specific markers: H, BE, MS, R3 indicators
Large LONG triangles when any pattern detected
Pattern labels showing name and type (REVERSAL/CONTINUATION)
Real-time trend detection with EMA
Info table showing all active patterns
Individual alerts for each pattern type
Customizable parameters for sensitivity
Color-coded backgrounds for entry signals
⚙️ CUSTOMIZABLE SETTINGS:
Trend detection length (default 20)
Hammer wick ratio requirements
Engulfing size multipliers
Pattern sensitivity adjustments
This indicator gives you high-probability long entries based on proven Japanese candlestick patterns that show increasing buyer control!
Dynamic Rally Dashboard with Candle-by-Candle Alerts________________________________________
Overview
The Dynamic Rally Dashboard is a real-time TradingView indicator designed to provide traders with a visual representation of price movement, volume behavior, and trend strength. It captures both upward and downward rallies, determines their strength, and provides immediate alerts when significant price changes occur.
This dashboard is ideal for traders seeking a quick, candle-by-candle snapshot of market dynamics without relying on multiple timeframes.
________________________________________
Key Features
1. Price % Change
o Calculates the percentage change of price from the previous candle.
o Displays in green if positive, red if negative.
o Alerts when configured thresholds (up/down) are breached.
2. OBV (On-Balance Volume) Status
o Tracks cumulative buying/selling pressure.
o Displays percentage change relative to a 20-period SMA.
o Color-coded to show rising (green) or falling (red) OBV.
3. ADX (Average Directional Index)
o Measures trend strength.
o Numeric value displayed on the dashboard.
o Threshold configurable; values above indicate strong trends.
4. Rally Status
o Determines the current rally based on price movement, OBV, and ADX.
o Possible statuses:
Up Rally Getting Stronger
Up Rally Weakening
Down Rally Getting Stronger
Down Rally Weakening
Neutral
o Updates dynamically on each new candle.
5. Dashboard Customization
o Font Size: Tiny, Small, Normal, Large.
o Table Position: Top Left, Top Right, Bottom Left, Bottom Right.
o Layout: Vertical or Horizontal.
6. Alerts
o Triggered when price % change exceeds configurable up/down thresholds.
o Alerts include the ticker, % change, and current rally status.
o Candle-by-candle updates ensure alerts reflect the latest market behavior.
________________________________________
How to Interpret the Dashboard
1. Price % Change:
o Green: price increased since the previous candle.
o Red: price decreased since the previous candle.
2. OBV Status:
o Green: buying pressure supporting the rally.
o Red: selling pressure increasing, rally may weaken.
3. ADX Value:
o Higher values (> threshold) indicate a strong trend.
o Lower values suggest a weaker trend.
4. Rally Status:
o Combines price direction, OBV, and ADX to indicate if a rally is strengthening or weakening.
o Useful to gauge momentum, whether bullish or bearish.
Example:
• Price % Change: +1.2%
• OBV Rising: +3%
• ADX: 28 (above threshold 25)
• Rally Status: "Up Rally Getting Stronger"
• Interpretation: The market is moving upward with strong buying pressure and a strong trend.
________________________________________
Actionable Guidance for Traders
• Up Rally Getting Stronger: Consider bullish positions or holding long trades.
• Up Rally Weakening: Be cautious; consider partial profit-taking or tightening stop-loss.
• Down Rally Getting Stronger: Consider bearish positions or short trades.
• Down Rally Weakening: Watch for potential reversals; manage risk.
• Neutral: No clear trend; consider staying on the sidelines.
Note: Always combine this dashboard with your trading strategy, risk management, and other analyses.
________________________________________
Alerts Usage
• Configure up/down thresholds based on your preferred sensitivity.
• Alerts will notify you instantly when the price moves significantly, including the current rally status.
• Helps in catching strong rallies early or identifying weakening momentum.
________________________________________
Disclaimer
The Dynamic Rally Dashboard is provided for educational and informational purposes only. Trading involves risk, and past performance does not guarantee future results.
No liability is assumed by the author for any trading losses or damages resulting from the use of this indicator. Traders are solely responsible for their own trades and risk management decisions.
________________________________________

Market Structure 2.0- Zig Zag , BoS and Supply/Demand ZonesMarket Structure 2.0- Zig Zag, BoS and Supply/Demand
Unlock the full picture of market structure with this all-in-one indicator. At its core, it’s built around precise price action reversals, detected through smart engulfment of highs and lows. Every reversal acts as a single, powerful trigger that automatically maps out supply and demand zones and structural levels (swing high/lows, BoS and market shift) — everything you need to understand the market at a glance.
Whether you’re scanning for trend continuation, identifying structural levels for entries and exits, or marking key areas for Fibonacci retracements, this indicator simplifies it all. BoS signals help you ride the prevailing trend, zones highlight areas of interest, and swing highs/lows give you structural context — all perfectly aligned with each other, all as a result of price-action based reversals.
Want to see the bigger picture? The HTF input lets you track higher timeframe structures right on your current chart, giving you an edge for live trading. Just remember: for consistent results, refresh your chart before observing HTF structure, and use caution when back-testing, as higher timeframe patterns may appear inconsistent in bar-replay (refresh chart regularly for accurate results). Also, be aware that supply/demand zones are most accurate on the chosen timeframes raw timeframe (for example if using 4h on HTF input, 4h supply/demand zones are more accurate when observing 4h chart and may show discrepancy on lower timeframes).
With this tool, the chaos of the market is transformed into a clean, actionable map — all guided by the same unique reversal logic.
Real-Time Alerts
This indicator doesn’t just visualize market structure — it actively notifies you when critical events occur, so you can observe passively without being glued to the charts. Alerts are fully customizable and cover every key element of market behavior:
Supply & Demand Zones
• New Supply Zone (Bullish) – Triggers when a fresh supply area forms.
• New Demand Zone (Bearish) – Alerts you to newly established demand.
Internal Shifts & Swing Points
• Bullish Internal Shift – Detects bullish price shifts across all swing lows.
• Bearish Internal Shift – Detects bearish shifts across all swing highs.
• Higher Highs (HH) / Higher Lows (HL) / Lower Highs (LH) / Lower Lows (LL) – Track critical swing points with precise conditions to avoid false signals.
• Liquidity Sweeps (LS) – Alerts when price sweeps stop-loss areas, signaling potential traps or continuation setups.
Market Structure & Breaks of Structure (BoS)
• Bullish / Bearish BoS – Highlights breaks in structure that confirm trend continuation or reversals.
• Bullish / Bearish Market Shifts – Flags larger trend changes detected by the indicator’s unique reversal logic.
Alerts can be triggered on LTF , MTF , or HTF charts, giving you flexibility to match your trading style. Each alert is configurable, so you receive only the notifications that matter to you — whether it’s swing points, market shifts, or key supply and demand levels.
With these alerts, you’re not just watching the market — you’re anticipating it.

Adaptive Machine Learning Trading System [PhenLabs]📊Adaptive ML Trading System
Version: PineScript™v6
📌Description
The Adaptive ML Trading System is a sophisticated machine learning indicator that combines ensemble modeling with advanced technical analysis. This system uses XGBoost, Random Forest, and Neural Network algorithms to generate high-confidence trading signals while incorporating robust risk management features. Traders benefit from objective, data-driven decision-making that adapts to changing market conditions.
🚀Points of Innovation
• Machine Learning Ensemble - Three integrated models (XGBoost, Random Forest, Neural Network)
• Confidence-Based Trading - Only executes trades when ML confidence exceeds threshold
• Dynamic Risk Management - ATR-based stop loss and max drawdown protection
• Adaptive Position Sizing - Volatility-adjusted position sizing with confidence weighting
• Real-Time Performance Metrics - Live tracking of win rate, Sharpe ratio, and performance
• Multi-Timeframe Feature Analysis - Adaptive lookback periods for different market regimes
🔧Core Components
• ML Ensemble Engine - Weighted combination of XGBoost, Random Forest, and Neural Network outputs
• Feature Normalization System - Advanced preprocessing with custom tanh/sigmoid activation
• Risk Management Module - Dynamic position sizing and drawdown protection
• Performance Dashboard - Real-time metrics and risk status monitoring
• Alert System - Comprehensive alert conditions for entries, exits, and risk events
🔥Key Features
• High-confidence ML signals with customizable confidence thresholds
• Multiple trading modes (Conservative, Balanced, Aggressive) for different risk profiles
• Integrated stop loss and risk management with ATR-based calculations
• Real-time performance metrics including win rate and Sharpe ratio
• Comprehensive alert system with entry, exit, and risk management notifications
• Visual confidence bands and threshold indicators for easy signal interpretation
🎨Visualization
• ML Signal Line - Primary signal output ranging from -1 to +1
• Confidence Bands - Visual representation of model confidence levels
• Threshold Lines - Customizable buy/sell threshold levels
• Position Histogram - Current market position visualization
• Performance Tables - Real-time metrics display in customizable positions
📖Usage Guidelines
Model Configuration
• Confidence Threshold: Default 0.55, Range 0.5-0.95 - Minimum confidence for signals
• Model Sensitivity: Default 0.9, Range 0.1-2.0 - Adjusts signal sensitivity
• Ensemble Mode: Conservative/Balanced/Aggressive - Trading style preference
• Signal Threshold: Default 0.55, Range 0.3-0.9 - ML signal threshold for entries
Risk Management
• Position Size %: Default 10%, Range 1-50% - Portfolio percentage per trade
• Max Drawdown %: Default 15%, Range 5-30% - Maximum allowed drawdown
• Stop Loss ATR: Default 2.0, Range 0.5-5.0 - Stop loss in ATR multiples
• Dynamic Sizing: Default true - Volatility-based position adjustment
Display Settings
• Show Signals: Default true - Display entry/exit signals
• Show Threshold Signals: Default true - Display ±0.6 threshold crosses
• Show Confidence Bands: Default true - Display ML confidence levels
• Performance Dashboard: Default true - Show metrics table
✅Best Use Cases
• Swing trading with 1-5 day holding periods
• Trend-following strategies in established trends
• Volatility breakout trading during high-confidence periods
• Risk-adjusted position sizing for portfolio management
• Multi-timeframe confirmation for existing strategies
⚠️Limitations
• Requires sufficient historical data for accurate ML predictions
• May experience low confidence periods in choppy markets
• Performance varies across different asset classes and timeframes
• Not suitable for very short-term scalping strategies
• Requires understanding of basic risk management principles
💡What Makes This Unique
• True machine learning ensemble with multiple model types
• Confidence-based trading rather than simple signal generation
• Integrated risk management with dynamic position sizing
• Real-time performance tracking and metrics
• Adaptive parameters that adjust to market conditions
🔬How It Works
Feature Calculation: Computes 20+ technical features from price/volume data
Feature Normalization: Applies custom normalization for ML compatibility
Ensemble Prediction: Combines XGBoost, Random Forest, and Neural Network outputs
Signal Generation: Produces confidence-weighted trading signals
Risk Management: Applies position sizing and stop loss rules
Execution: Generates alerts and visual signals based on thresholds
💡Note:
This indicator works best on daily and 4-hour timeframes for most assets. Ensure you understand the risk management settings before live trading. The system includes automatic risk-off modes that halt trading during excessive drawdown periods.

MACD Forecast [Titans_Invest]MACD Forecast — The Future of MACD in Trading
The MACD has always been one of the most powerful tools in technical analysis.
But what if you could see where it’s going, instead of just reacting to what has already happened?
Introducing MACD Forecast — the natural evolution of the MACD Full , now taken to the next level. It’s the world’s first MACD designed not only to analyze the present but also to predict the future behavior of momentum.
By combining the classic MACD structure with projections powered by Linear Regression, this indicator gives traders an anticipatory, predictive view, redefining what’s possible in technical analysis.
Forget lagging indicators.
This is the smartest, most advanced, and most accurate MACD ever created.
🍟 WHY MACD FORECAST IS REVOLUTIONARY
Unlike the traditional MACD, which only reflects current and past price dynamics, the MACD Forecast uses regression-based projection models to anticipate where the MACD line, signal line, and histogram are heading.
This means traders can:
• See MACD crossovers before they happen.
• Spot trend reversals earlier than most.
• Gain an unprecedented timing advantage in both discretionary and automated trading.
In other words: this indicator lets you trade ahead of time.
🔮 FORECAST ENGINE — POWERED BY LINEAR REGRESSION
At its core, the MACD Forecast integrates Linear Regression (ta.linreg) to project the MACD’s future behavior with exceptional accuracy.
Projection Modes:
• Flat Projection: Assumes trend continuity at the current level.
• LinReg Projection: Applies linear regression across N periods to mathematically forecast momentum shifts.
This dual system offers both a conservative and adaptive view of market direction.
📐 ACCURACY WITH FULL CUSTOMIZATION
Just like the MACD Full, this new version comes with 20 customizable buy-entry conditions and 20 sell-entry conditions — now enhanced with forecast-based rules that anticipate crossovers and trend reversals.
You’re not just reacting — you’re strategizing ahead of time.
⯁ HOW TO USE MACD FORECAST❓
The MACD Forecast is built on the same foundation as the classic MACD, but with predictive capabilities.
Step 1 — Spot Predicted Crossovers:
Watch for forecasted bullish or bearish crossovers. These signals anticipate when the MACD line will cross the signal line in the future, letting you prepare trades before the move.
Step 2 — Confirm with Histogram Projection:
Use the projected histogram to validate momentum direction. A rising histogram signals strengthening bullish momentum, while a falling projection points to weakening or bearish conditions.
Step 3 — Combine with Multi-Timeframe Analysis:
Use forecasts across multiple timeframes to confirm signal strength (e.g., a 1h forecast aligned with a 4h forecast).
Step 4 — Set Entry Conditions & Automation:
Customize your buy/sell rules with the 20 forecast-based conditions and enable automation for bots or alerts.
Step 5 — Trade Ahead of the Market:
By preparing for future momentum shifts instead of reacting to the past, you’ll always stay one step ahead of lagging traders.
🤖 BUILT FOR AUTOMATION AND BOTS 🤖
Whether for manual trading, quantitative strategies, or advanced algorithms, the MACD Forecast was designed to integrate seamlessly with automated systems.
With predictive logic at its core, your strategies can finally react to what’s coming, not just what already happened.
🥇 WHY THIS INDICATOR IS UNIQUE 🥇
• World’s first MACD with Linear Regression Forecasting
• Predictive Crossovers (before they appear on the chart)
• Maximum flexibility with Long & Short combinations — 20+ fully configurable conditions for tailor-made strategies
• Fully automatable for quantitative systems and advanced bots
This isn’t just an update.
It’s the final evolution of the MACD.
______________________________________________________
🔹 CONDITIONS TO BUY 📈
______________________________________________________
• Signal Validity: The signal will remain valid for X bars .
• Signal Sequence: Configurable as AND or OR .
🔹 MACD > Signal Smoothing
🔹 MACD < Signal Smoothing
🔹 Histogram > 0
🔹 Histogram < 0
🔹 Histogram Positive
🔹 Histogram Negative
🔹 MACD > 0
🔹 MACD < 0
🔹 Signal > 0
🔹 Signal < 0
🔹 MACD > Histogram
🔹 MACD < Histogram
🔹 Signal > Histogram
🔹 Signal < Histogram
🔹 MACD (Crossover) Signal
🔹 MACD (Crossunder) Signal
🔹 MACD (Crossover) 0
🔹 MACD (Crossunder) 0
🔹 Signal (Crossover) 0
🔹 Signal (Crossunder) 0
🔮 MACD (Crossover) Signal Forecast
🔮 MACD (Crossunder) Signal Forecast
______________________________________________________
______________________________________________________
🔸 CONDITIONS TO SELL 📉
______________________________________________________
• Signal Validity: The signal will remain valid for X bars .
• Signal Sequence: Configurable as AND or OR .
🔸 MACD > Signal Smoothing
🔸 MACD < Signal Smoothing
🔸 Histogram > 0
🔸 Histogram < 0
🔸 Histogram Positive
🔸 Histogram Negative
🔸 MACD > 0
🔸 MACD < 0
🔸 Signal > 0
🔸 Signal < 0
🔸 MACD > Histogram
🔸 MACD < Histogram
🔸 Signal > Histogram
🔸 Signal < Histogram
🔸 MACD (Crossover) Signal
🔸 MACD (Crossunder) Signal
🔸 MACD (Crossover) 0
🔸 MACD (Crossunder) 0
🔸 Signal (Crossover) 0
🔸 Signal (Crossunder) 0
🔮 MACD (Crossover) Signal Forecast
🔮 MACD (Crossunder) Signal Forecast
______________________________________________________
______________________________________________________
🔮 Linear Regression Function 🔮
______________________________________________________
• Our indicator includes MACD forecasts powered by linear regression.
Forecast Types:
• Flat: Assumes prices will stay the same.
• Linreg: Makes a 'Linear Regression' forecast for n periods.
Technical Information:
• Function: ta.linreg()
Parameters:
• source: Source price series.
• length: Number of bars (period).
• offset : Offset.
• return: Linear regression curve.
______________________________________________________
______________________________________________________
⯁ UNIQUE FEATURES
______________________________________________________
Linear Regression: (Forecast)
Signal Validity: The signal will remain valid for X bars
Signal Sequence: Configurable as AND/OR
Table of Conditions: BUY/SELL
Conditions Label: BUY/SELL
Plot Labels in the graph above: BUY/SELL
Automate & Monitor Signals/Alerts: BUY/SELL
Linear Regression (Forecast)
Signal Validity: The signal will remain valid for X bars
Signal Sequence: Configurable as AND/OR
Table of Conditions: BUY/SELL
Conditions Label: BUY/SELL
Plot Labels in the graph above: BUY/SELL
Automate & Monitor Signals/Alerts: BUY/SELL
______________________________________________________
📜 SCRIPT : MACD Forecast
🎴 Art by : @Titans_Invest & @DiFlip
👨💻 Dev by : @Titans_Invest & @DiFlip
🎑 Titans Invest — The Wizards Without Gloves 🧤
✨ Enjoy!
______________________________________________________
o Mission 🗺
• Inspire Traders to manifest Magic in the Market.
o Vision 𐓏
• To elevate collective Energy 𐓷𐓏
🎗️ In memory of João Guilherme — your light will live on forever.


Dynamic % Price Change Table with Immediate AlertsDescription:
Stop struggling to track price changes across charts! This indicator shows the real-time percentage change of the last candle for the currently opened stock/chart in a color-coded table. Alerts are triggered immediately when the price change crosses user-defined thresholds, helping you catch moves instantly.
Features:
Dynamic table updating per chart symbol and timeframe
Immediate intrabar alerts for % up/down thresholds
Fully configurable thresholds for alerts. Y OU CAN SET ALERTS FOR YOUR ENTIRE WATCLIST .
No more hassle tracking % price changes manually
Lightweight and optimized for intraday trading.
This code is tested but please start using and let me know if anything is not working fine.

Multi-Timeframe MACD ConfluenceMulti-Timeframe MACD Confluence Indicator
This indicator plots Buy and Sell signals based on the confluence of MACD histogram direction across three different timeframes. When the MACD histogram is bullish (above zero) on all selected timeframes, a Buy signal is triggered. When it's bearish (below zero) on all, a Sell signal is shown.
🧠 Key Features:
Customizable timeframes (default: 5min, 15min, 1hr)
Uses traditional MACD: 12/26/9 EMA
Works on any asset or timeframe
Provides visual plot signals and built-in alerts
📈 This tool is ideal for traders who rely on multi-timeframe analysis to validate trend momentum before taking entries.

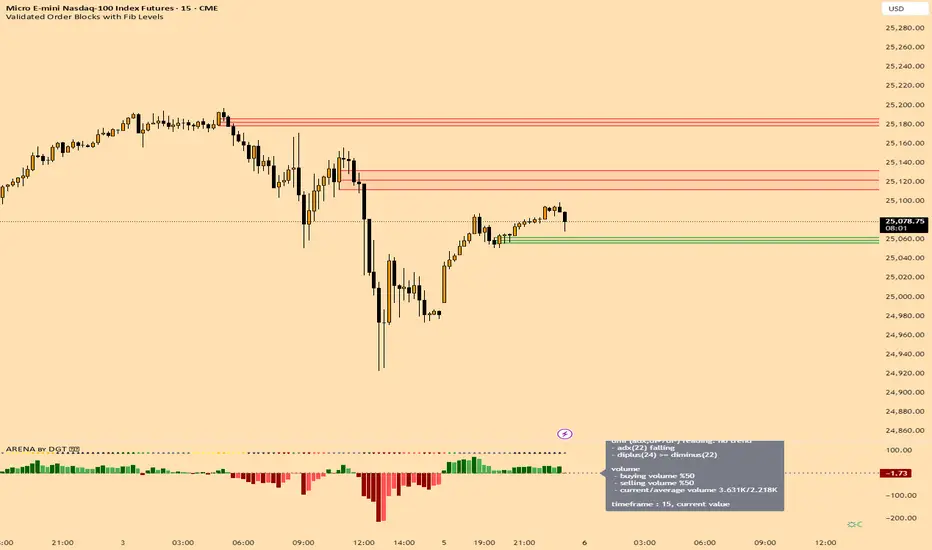
Validated Order Blocks with Fib LevelsThis indicator automatically identifies and displays Smart Money Concepts (SMC) order blocks based on market structure breaks:
How it works:
Bearish Order Blocks (Red): Marks the last bullish candle before a swing high. The OB becomes valid when price breaks below the previous swing low, indicating institutional selling zones. Drawn from the candle's close (body top) to its low (bottom wick).
Bullish Order Blocks (Green): Marks the last bearish candle before a swing low. The OB becomes valid when price breaks above the previous swing high, indicating institutional buying zones. Drawn from the candle's high (top wick) to its close (body bottom).
Features:
Three Fibonacci retracement levels (50%, 75%, 100%) for each order block
Fib 100% faces downward on bearish OBs and upward on bullish OBs
Auto-validation: OBs are removed when price closes through them
Customizable: Adjustable swing detection, timeframe selection, and OB display limits
Optional Break of Structure (BOS) markers to show when OBs activate
Works on any timeframe with HTF analysis support
Perfect for identifying key institutional support/resistance zones and potential reversal areas.
Bazaarbull - Smart Money Concepts// This Pine Script™ code is subject to the terms of the Mozilla Public License 2.0 at mozilla.org
// © Bazaarbull
//
//@version=5
indicator("Bazaarbull - Smart Money Concepts", "Bazaarbull - Smart Money Concepts ",
overlay = true,
max_bars_back = 5000,
max_boxes_count = 500,
max_labels_count = 500,
max_lines_count = 500,
max_polylines_count = 100)
plot(na)
//
MSG = "MARKET STRUCTURE"
VBG = "VOLUMETRIC ORDER BLOCKS"
MST = "Limit market structure calculation to improve memory speed time"
SLT = " Limit swing structure to tot bars back"
IDT = " Start date of the internal structure"
CST = "Color candle based on trend detection system"
OBT = "Display internal buy and sell activity"
OBD = "Show Last number of orderblock"
OBMT = " Use Length to adjust cordinate of the orderblocks Use whole candle body"
_ ='
------------
–––––––––––––––––––––––––– INPUTS –––––––––––––––––––––––––––
------------ '//{
bool windowsis = input.bool(true, "Window", inline="kla", group=MSG)
int mswindow = input.int(5000, "", tooltip=MST,group=MSG, inline="kla", minval=1000)
bool showSwing = input.bool(true, "Swing", inline="scss", group=MSG)
int swingLimit = input.int(100, "", tooltip=SLT, inline="scss", group=MSG, minval=10, maxval=200)
color swingcssup = input.color(#089981, "", inline="scss", group=MSG)
color swingcssdn = input.color(#f23645, "", inline="scss", group=MSG)
bool showMapping = input.bool(false, "Mapping Structure", inline="mapping", group=MSG)
string mappingStyle = input.string("----", "", options= , inline="mapping", group=MSG)
color mappingcss = input.color(color.silver, "", tooltip="Display Mapping Structure", inline="mapping", group=MSG)
bool candlecss = input.bool(false, "Color Candles", tooltip=CST, group=MSG, inline="txt")
string mstext = input.string("Tiny", "", options= ,
inline="txt", group=MSG)
string msmode = input.string("Adjusted Points", "Algorithmic Logic", options=
, inline="node", group=MSG)
int mslen = input.int(5, "", inline="node", group=MSG, minval=2)
bool buildsweep = input.bool(true, "Build Sweep (x)", "Build sweep on market structure", "znc", MSG)
bool msbubble = input.bool(true, "Bubbles", tooltip="Display Circle Bubbles", inline="bubbles", group=MSG)
bool obshow = input.bool(true, "Show Last", tooltip=OBD, group=VBG, inline="obshow")
int oblast = input.int(5, "", group=VBG, inline="obshow", minval=0)
color obupcs = input.color(color.new(#089981, 90), "", inline="obshow", group=VBG)
color obdncs = input.color(color.new(#f23645, 90), "", inline="obshow", group=VBG)
bool obshowactivity = input.bool(true, "Show Buy/Sell Activity", inline="act", group=VBG, tooltip=OBT)
color obactup = input.color(color.new(#089981, 50), "", inline="act", group=VBG)
color obactdn = input.color(color.new(#f23645, 50), "", inline="act", group=VBG)
obshowbb = input.bool(false, "Show Breakers", inline="bb", group=VBG, tooltip="Display Breakers")
color bbup = input.color(color.new(#089981, 100), "", inline="bb", group=VBG)
color bbdn = input.color(color.new(#f23645, 100), "", inline="bb", group=VBG)
obmode = input.string("Length", "Construction", options= , tooltip=OBMT, inline="atr", group=VBG)
len = input.int(5, "", inline="atr", group=VBG, minval=1)
obmiti = input.string("Close", "Mitigation Method", options= ,
tooltip="Mitigation method for when to trigger order blocks", group=VBG)
obtxt = input.string("Normal", "Metric Size", options= ,
tooltip="Order block Metrics text size", inline="txt", group=VBG)
showmetric = input.bool(true, "Show Metrics", group=VBG)
showline = input.bool(true, "Show Mid-Line", group=VBG)
overlap = input.bool(true, "Hide Overlap", group=VBG, inline="ov")
wichlap = input.string("Recent", "", options= , inline="ov", group=VBG)
fvg_enable = input.bool(false, "", inline="1", group="FAIR VALUE GAP", tooltip="Display fair value gap")
what_fvg = input.string("FVG", "", inline="1", group="FAIR VALUE GAP", tooltip="Display fair value gap",
options= )
fvg_num = input.int(5, "Show Last", inline="1a", group="FAIR VALUE GAP", tooltip="Number of fvg to show", minval=0)
fvg_upcss = input.color(color.new(#089981, 80), "", inline="1", group="FAIR VALUE GAP")
fvg_dncss = input.color(color.new(#f23645, 80), "", inline="1", group="FAIR VALUE GAP")
fvgbbup = input.color(color.new(#089981, 100), "", inline="1", group="FAIR VALUE GAP")
fvgbbdn = input.color(color.new(#f23645, 100), "", inline="1", group="FAIR VALUE GAP")
fvg_src = input.string("Close", "Mitigation",
inline="3",
group="FAIR VALUE GAP",
tooltip=" Use the close of the body as trigger Use the extreme point of the body as trigger",
options= )
fvgthresh = input.float(0, "Threshold", tooltip="Filter out non significative FVG", group="FAIR VALUE GAP",
inline="asd", minval=0, maxval=2, step=0.1)
fvgoverlap = input.bool(true, "Hide Overlap", "Hide overlapping FVG", group="FAIR VALUE GAP")
fvgline = input.bool(true, "Show Mid-Line", group="FAIR VALUE GAP")
fvgextend = input.bool(false, "Extend FVG", group="FAIR VALUE GAP")
dispraid = input.bool(false, "Display Raids", inline="raid", group="FAIR VALUE GAP")
//}
_ ='
------------
–––––––––––––––––––––––––– UDT –––––––––––––––––––––––––––
------------ '//{
type hqlzone
box pbx
box ebx
box lbx
label plb
label elb
label lbl
type Zphl
line top
line bottom
label top_label
label bottom_label
bool stopcross
bool sbottomcross
bool itopcross
bool ibottomcross
string txtup
string txtdn
float topy
float bottomy
float topx
float bottomx
float tup
float tdn
int tupx
int tdnx
float itopy
float itopx
float ibottomy
float ibottomx
float uV
float dV
type entered
bool normal = false
bool breaker = false
type store
line ln
label lb
box bx
linefill lf
type structure
int zn
float zz
float bos
float choch
int loc
int temp
int trend
int start
float main
int xloc
bool upsweep
bool dnsweep
string txt = na
type drawms
int x1
int x2
float y
string txt
color css
string style
type ob
bool bull
float top
float btm
float avg
int loc
color css
float vol
int dir
int move
int blPOS
int brPOS
int xlocbl
int xlocbr
bool isbb = false
int bbloc
type FVG
float top = na
float btm = na
int loc = bar_index
bool isbb = false
int bbloc = na
bool israid = false
float raidy = na
int raidloc = na
int raidx2 = na
bool active = false
color raidcs = na
type SFP
float y
int loc
float ancor
type sfpbuildlbl
int x
float y
string style
color css
string txt
type sfpbuildline
int x1
int x2
float y
color css
float ancor
int loc
type equalbuild
int x1
float y1
int x2
float y2
color css
string style
type equalname
int x
float y
string txt
color css
string style
type ehl
float pt
int t
float pb
int b
type sellbuyside
float top
float btm
int loc
color css
string txt
float vol
type timer
bool start = false
int count = 0
//}
_ ='
------------
–––––––––––––––––––––––––– SETUP –––––––––––––––––––––––––––
------------ '//{
var store bin = store.new(
array.new< line >()
, array.new< label >()
, array.new< box >()
, array.new()
)
var entered blobenter = entered.new()
var entered brobenter = entered.new()
var entered blfvgenter = entered.new()
var entered brfvgenter = entered.new()
var entered blarea = entered.new()
var entered brarea = entered.new()
var timer lc = timer.new ()
if barstate.islast
for obj in bin.ln
obj.delete()
for obj in bin.lb
obj.delete()
for obj in bin.bx
obj.delete()
for obj in bin.lf
obj.delete()
bin.ln.clear()
bin.lb.clear()
bin.bx.clear()
bin.lf.clear()
invcol = #ffffff00
float atr = (ta.atr(200) / (5/len))
//}
_ ='
------------
–––––––––––––––––––––––––– UTILITY –––––––––––––––––––––––––––
------------ '//{
method txSz(string s) =>
out = switch s
"Tiny" => size.tiny
"Small" => size.small
"Normal" => size.normal
"Large" => size.large
"Huge" => size.huge
"Auto" => size.auto
out
method lstyle(string style) =>
out = switch style
'⎯⎯⎯⎯' => line.style_solid
'----' => line.style_dashed
'····' => line.style_dotted
ghl() => [high , low , close , open , close, open, high, low, high , low , ta.atr(200)]
method IDMIDX(bool use_max, int loc) =>
min = 99999999.
max = 0.
idx = 0
if use_max
for i = 0 to (bar_index - loc)
max := math.max(high , max)
min := max == high ? low : min
idx := max == high ? i : idx
else
for i = 0 to (bar_index - loc)
min := math.min(low , min)
max := min == low ? high : max
idx := min == low ? i : idx
idx
SFPData() => [high, high , high , low, low , low , close, volume, time, bar_index , time ]
SFPcords() =>
RealTF = barstate.isrealtime ? 0 : 1
= SFPData()
[h , h1 , h2 , l , l1 , l2 , c , v , t , n , t1 ]
method find(structure ms, bool use_max, bool sweep, bool useob) =>
min = 99999999.
max = 0.
idx = 0
if not sweep
if ((bar_index - ms.loc) - 1) > 0
if use_max
for i = 0 to (bar_index - ms.loc) - 1
max := math.max(high , max)
min := max == high ? low : min
idx := max == high ? i : idx
if useob
if high > high
max := high
min := low
idx := idx + 1
else
for i = 0 to (bar_index - ms.loc) - 1
min := math.min(low , min)
max := min == low ? high : max
idx := min == low ? i : idx
if useob
if low < low
max := high
min := low
idx := idx + 1
else
if use_max
for i = 0 to (bar_index - ms.loc)
max := math.max(high , max)
min := max == high ? low : min
idx := max == high ? i : idx
if useob
if high > high
max := high
min := low
idx := idx + 1
else
for i = 0 to (bar_index - ms.loc)
min := math.min(low , min)
max := min == low ? high : max
idx := min == low ? i : idx
if useob
if low < low
max := high
min := low
idx := idx + 1
else
if ((bar_index - ms.xloc) - 1) > 0
if use_max
for i = 0 to (bar_index - ms.xloc) - 1
max := math.max(high , max)
min := max == high ? low : min
idx := max == high ? i : idx
if useob
if high > high
max := high
min := low
idx := idx + 1
else
for i = 0 to (bar_index - ms.xloc) - 1
min := math.min(low , min)
max := min == low ? high : max
idx := min == low ? i : idx
if useob
if low < low
max := high
min := low
idx := idx + 1
else
if use_max
for i = 0 to (bar_index - ms.xloc)
max := math.max(high , max)
min := max == high ? low : min
idx := max == high ? i : idx
if useob
if high > high
max := high
min := low
idx := idx + 1
else
for i = 0 to (bar_index - ms.xloc)
min := math.min(low , min)
max := min == low ? high : max
idx := min == low ? i : idx
if useob
if low < low
max := high
min := low
idx := idx + 1
idx
method fnOB(ob block, bool bull, float cords, int idx) =>
switch bull
true =>
blobenter.normal := false
blobenter.breaker := false
block.unshift(
ob.new(
true
, cords
, low
, math.avg(cords, low )
, time
, obupcs
, volume
, close > open ? 1 : -1
, 1
, 1
, 1
, time
)
)
false =>
brobenter.normal := false
brobenter.breaker := false
block.unshift(
ob.new(
false
, high
, cords
, math.avg(cords, high )
, time
, obdncs
, volume
, close > open ? 1 : -1
, 1
, 1
, 1
, time
)
)
method mitigated(ob block) =>
if barstate.isconfirmed
for in block
if not stuff.isbb
switch stuff.bull
true =>
if obmiti == "Close" ? math.min(close, open) < stuff.btm : obmiti == "Wick" ? low < stuff.btm : obmiti == "Avg" ? low < stuff.avg : na
stuff.isbb := true
stuff.bbloc := time
if not obshowbb
block.remove(i)
false =>
if obmiti == "Close" ? math.max(close, open) > stuff.top : obmiti == "Wick" ? high > stuff.top : obmiti == "Avg" ? high > stuff.avg : na
stuff.isbb := true
stuff.bbloc := time
if not obshowbb
block.remove(i)
else
switch stuff.bull
true =>
if obmiti == "Close" ? math.max(close, open) > stuff.top : obmiti == "Wick" ? high > stuff.top : obmiti == "Avg" ? high > stuff.avg : na
block.remove(i)
false =>
if obmiti == "Close" ? math.min(close, open) < stuff.btm : obmiti == "Wick" ? low < stuff.btm : obmiti == "Avg" ? low < stuff.avg : na
block.remove(i)
overlap(ob bull, ob bear) =>
if bull.size() > 1
for i = bull.size() - 1 to 1
stuff = bull.get(i)
current = bull.get(0)
v = wichlap == "Recent" ? i : 0
switch
stuff.btm > current.btm and stuff.btm < current.top => bull.remove(v)
stuff.top < current.top and stuff.btm > current.btm => bull.remove(v)
stuff.top > current.top and stuff.btm < current.btm => bull.remove(v)
stuff.top < current.top and stuff.top > current.btm => bull.remove(v)
if bear.size() > 1
for i = bear.size() - 1 to 1
stuff = bear.get(i)
current = bear.get(0)
v = wichlap == "Recent" ? i : 0
switch
stuff.btm > current.btm and stuff.btm < current.top => bear.remove(v)
stuff.top < current.top and stuff.btm > current.btm => bear.remove(v)
stuff.top > current.top and stuff.btm < current.btm => bear.remove(v)
stuff.top < current.top and stuff.top > current.btm => bear.remove(v)
if bull.size() > 0 and bear.size() > 0
for i = bull.size() - 1 to 0
stuff = bull.get(i)
current = bear.get(0)
v = wichlap == "Recent" ? 0 : i
switch
stuff.btm > current.btm and stuff.btm < current.top => bull.remove(v)
stuff.top < current.top and stuff.btm > current.btm => bull.remove(v)
stuff.top > current.top and stuff.btm < current.btm => bull.remove(v)
stuff.top < current.top and stuff.top > current.btm => bull.remove(v)
if bull.size() > 0 and bear.size() > 0
for i = bear.size() - 1 to 0
stuff = bear.get(i)
current = bull.get(0)
v = wichlap == "Recent" ? 0 : i
switch
stuff.btm > current.btm and stuff.btm < current.top => bear.remove(v)
stuff.top < current.top and stuff.btm > current.btm => bear.remove(v)
stuff.top > current.top and stuff.btm < current.btm => bear.remove(v)
stuff.top < current.top and stuff.top > current.btm => bear.remove(v)
overlapFVG(FVG blFVG, FVG brFVG) =>
if blFVG.size() > 1
for i = blFVG.size() - 1 to 1
stuff = blFVG.get(i)
current = blFVG.get(0)
switch
stuff.btm > current.btm and stuff.btm < current.top => blFVG.remove(i)
stuff.top < current.top and stuff.btm > current.btm => blFVG.remove(i)
stuff.top > current.top and stuff.btm < current.btm => blFVG.remove(i)
stuff.top < current.top and stuff.top > current.btm => blFVG.remove(i)
if brFVG.size() > 1
for i = brFVG.size() - 1 to 1
stuff = brFVG.get(i)
current = brFVG.get(0)
switch
stuff.btm > current.btm and stuff.btm < current.top => brFVG.remove(i)
stuff.top < current.top and stuff.btm > current.btm => brFVG.remove(i)
stuff.top > current.top and stuff.btm < current.btm => brFVG.remove(i)
stuff.top < current.top and stuff.top > current.btm => brFVG.remove(i)
if blFVG.size() > 0 and brFVG.size() > 0
for i = blFVG.size() - 1 to 0
stuff = blFVG.get(i)
current = brFVG.get(0)
switch
stuff.btm > current.btm and stuff.btm < current.top => blFVG.remove(i)
stuff.top < current.top and stuff.btm > current.btm => blFVG.remove(i)
stuff.top > current.top and stuff.btm < current.btm => blFVG.remove(i)
stuff.top < current.top and stuff.top > current.btm => blFVG.remove(i)
if blFVG.size() > 0 and brFVG.size() > 0
for i = brFVG.size() - 1 to 0
stuff = brFVG.get(i)
current = blFVG.get(0)
switch
stuff.btm > current.btm and stuff.btm < current.top => brFVG.remove(i)
stuff.top < current.top and stuff.btm > current.btm => brFVG.remove(i)
stuff.top > current.top and stuff.btm < current.btm => brFVG.remove(i)
stuff.top < current.top and stuff.top > current.btm => brFVG.remove(i)
method umt(ob metric) =>
switch metric.dir
1 =>
switch metric.move
1 => metric.blPOS := metric.blPOS + 1, metric.move := 2
2 => metric.blPOS := metric.blPOS + 1, metric.move := 3
3 => metric.brPOS := metric.brPOS + 1, metric.move := 1
-1 =>
switch metric.move
1 => metric.brPOS := metric.brPOS + 1, metric.move := 2
2 => metric.brPOS := metric.brPOS + 1, metric.move := 3
3 => metric.blPOS := metric.blPOS + 1, metric.move := 1
if (time - time ) == (time - time )
metric.xlocbl := metric.loc + (time - time ) * metric.blPOS
metric.xlocbr := metric.loc + (time - time ) * metric.brPOS
method display(ob id, ob full, int i) =>
if not id.isbb
bin.bx.unshift(box.new (top = id.top, bottom = id.btm, left = id.loc, right = time , border_color = na , bgcolor = id.css, xloc = xloc.bar_time))
bin.bx.unshift(box.new (top = id.top, bottom = id.btm, left = time , right = time + 1 , border_color = na , bgcolor = id.css, xloc = xloc.bar_time, extend = extend.right))
else
bin.bx.unshift(box.new (top = id.top, bottom = id.btm, left = id.loc , right = id.bbloc , border_color = na , bgcolor = id.css , xloc = xloc.bar_time))
bin.bx.unshift(box.new (top = id.top, bottom = id.btm, left = id.bbloc , right = time , border_color = id.css , bgcolor = id.bull ? bbup : bbdn , xloc = xloc.bar_time, border_width = 2))
bin.bx.unshift(box.new (top = id.top, bottom = id.btm, left = time , right = time + 1 , border_color = id.css , bgcolor = id.bull ? bbup : bbdn , xloc = xloc.bar_time, extend = extend.right))
if obshowactivity
bin.bx.unshift(box.new (top = id.top, bottom = id.avg, left = id.loc , right = id.xlocbl, border_color = na , bgcolor = obactup, xloc = xloc.bar_time))
bin.bx.unshift(box.new (top = id.avg, bottom = id.btm, left = id.loc , right = id.xlocbr, border_color = na , bgcolor = obactdn, xloc = xloc.bar_time))
if showline
bin.ln.unshift(line.new(
x1 = id.loc
, x2 = time
, y1 = id.avg
, y2 = id.avg
, color = color.new(id.css, 0)
, xloc = xloc.bar_time
, style = line.style_dashed
)
)
if showmetric
if i == math.min(oblast - 1, full.size() - 1)
float tV = 0
float dV = array.new()
seq = math.min(oblast - 1, full.size() - 1)
for j = 0 to seq
cV = full.get(j)
tV += cV.vol
if j == seq
for y = 0 to seq
dV.push(
math.floor(
(full.get(y).vol / tV) * 100)
)
ids = full.get(y)
bin.lb.unshift(label.new(
bar_index - 1
, ids.avg
, textcolor = color.new(ids.css, 0)
, style = label.style_label_left
, size = obtxt.txSz()
, color = #ffffff00
, text =
str.tostring(
math.round(full.get(y).vol, 3), format = format.volume) + " (" + str.tostring(dV.get(y)) + "%)"
)
)
method dispFVG(FVG fvg, int i, bool bull) =>
ext = fvgextend ? extend.right : extend.none
if not fvg.isbb
bin.bx.unshift(box .new(top = fvg.top, bottom = fvg.btm, left = fvg.loc , right = time , border_color = na , bgcolor = bull ? fvg_upcss : fvg_dncss , xloc = xloc.bar_time, extend = ext))
if fvgline
bin.ln.unshift(line.new(x1 = fvg.loc, x2 = time , y1 = math.avg(fvg.top, fvg.btm), y2 = math.avg(fvg.top, fvg.btm), xloc = xloc.bar_time, color = color.new(bull ? fvg_upcss : fvg_dncss, 0) , extend = ext))
if dispraid
bin.ln.unshift(line.new(x1 = fvg.raidloc, x2 = fvg.raidx2, y1 = fvg.raidy, y2 = fvg.raidy, xloc = xloc.bar_time, color = fvg.raidcs))
bin.lb.unshift(label.new(x = int(math.avg(fvg.raidloc, fvg.raidx2)), y = fvg.raidy, text = "x", xloc = xloc.bar_time, textcolor = fvg.raidcs, style = bull ? label.style_label_up : label.style_label_down, size = size.small, color = #ffffff00))
else
bin.bx.unshift(box .new(top = fvg.top , bottom = fvg.btm, left = fvg.loc , right = fvg.bbloc , border_color = na , bgcolor = bull ? fvg_upcss : fvg_dncss, xloc = xloc.bar_time))
bin.bx.unshift(box .new(top = fvg.top , bottom = fvg.btm, left = fvg.bbloc , right = time , border_color = bull ? fvg_dncss : fvg_upcss , bgcolor = bull ? fvg_dncss : fvg_upcss, xloc = xloc.bar_time, extend = ext))
if fvgline
bin.ln.unshift(line.new(x1 = fvg.loc , x2 = fvg.bbloc , y1 = math.avg(fvg.top, fvg.btm), y2 = math.avg(fvg.top, fvg.btm), color = color.new(bull ? fvg_upcss : fvg_dncss, 0) , xloc = xloc.bar_time))
bin.ln.unshift(line.new(x1 = fvg.bbloc, x2 = time , y1 = math.avg(fvg.top, fvg.btm), y2 = math.avg(fvg.top, fvg.btm), color = color.new(bull ? fvg_dncss : fvg_upcss, 0) , xloc = xloc.bar_time, extend = ext, style = line.style_dashed))
//}
_ ='
------------
–––––––––––––––––––––––––– FUNCTION –––––––––––––––––––––––––––
------------ '//{
mapping() =>
var float up = na
var float dn = na
var float point = na
var int trend = 0
var int idx = na
var int sum = na
var int project = na
var chart.point charts = array.new()
if na(up)
up := high
idx := bar_index
if na(dn)
dn := low
idx := bar_index
if high > up
if trend == -1
id = IDMIDX(false, idx)
charts.unshift(
chart.point.from_time(
time
, low
)
)
idx := bar_index
point := low
sum := time
up := high
dn := low
project := time
trend := 1
if low < dn
if trend == 1
id = IDMIDX(true, idx)
charts.unshift(
chart.point.from_time(
time
, high
)
)
idx := bar_index
point := high
sum := time
up := high
dn := low
project := time
trend := -1
if barstate.islast
var line ln = na
var polyline pl = na
ln.delete()
pl.delete()
ln := na
pl := na
ln := line.new(
x1 = sum
, x2 = project
, y1 = point
, y2 = trend == 1 ? up : dn
, xloc = xloc.bar_time
, color = color.red
)
pl := polyline.new(
charts
, line_color = mappingcss
, xloc = xloc.bar_time
, line_style = mappingStyle.lstyle()
)
dFVG() =>
= ghl()
var FVG blFVG = array.new()
var FVG brFVG = array.new()
bool upfvg = false
bool dnfvg = false
float blth = l1 + (fvatr * fvgthresh)
float brth = h1 - (fvatr * fvgthresh)
cc = timeframe.change()
switch
what_fvg == "FVG" or what_fvg == "Breakers" =>
if l > h2 and cc and c1 > blth
upfvg := true
if l2 > h and cc and c1 < brth
dnfvg := true
if upfvg
if blFVG.size() > 0
fvg = blFVG.get(0)
if fvg.israid == true and fvg.active == false
fvg.active := true
fvg.raidloc := na
fvg.raidx2 := na
fvg.raidy := na
fvg.raidcs := #ffffff00
blFVG.unshift(
FVG.new(
l
, h2
, time
, false
, na
)
)
if dnfvg
if brFVG.size() > 0
fvg = brFVG.get(0)
if fvg.israid == true and fvg.active == false
fvg = brFVG.get(0)
fvg.active := true
fvg.active := true
fvg.raidloc := na
fvg.raidx2 := na
fvg.raidy := na
fvg.raidcs := #ffffff00
brFVG.unshift(
FVG.new(
l2
, h
, time
, false
, na
)
)
if blFVG.size() > 0
for in blFVG
if not fvg.isbb
if fvg_src == "Close" ? math.min(c, o) < fvg.btm : fvg_src == "Wick" ? l < fvg.btm : fvg_src == "Avg" ? l < math.avg(fvg.top, fvg.btm) : na
fvg.isbb := true
fvg.bbloc := time
if what_fvg == "FVG"
blFVG.remove(i)
else
if (fvg_src == "Close" ? math.max(c, o) > fvg.top : fvg_src == "Wick" ? h > fvg.top : fvg_src == "Avg" ? h > math.avg(fvg.top, fvg.btm) : na) and what_fvg == "Breakers"
blFVG.remove(i)
if brFVG.size() > 0
for in brFVG
if not fvg.isbb
if (fvg_src == "Close" ? math.max(c, o) > fvg.top : fvg_src == "Wick" ? h > fvg.top : fvg_src == "Avg" ? h > math.avg(fvg.top, fvg.btm) : na)
fvg.isbb := true
fvg.bbloc := time
if what_fvg == "FVG"
brFVG.remove(i)
else
if (fvg_src == "Close" ? math.min(c, o) < fvg.btm : fvg_src == "Wick" ? l < fvg.btm : fvg_src == "Avg" ? l < math.avg(fvg.top, fvg.btm) : na) and what_fvg == "Breakers"
brFVG.remove(i)
if fvgoverlap
overlapFVG(blFVG, brFVG)
if dispraid
for in blFVG
if not fvg.israid and not fvg.isbb
if low < fvg.top and close > fvg.top
fvg.israid := true
fvg.raidloc := time
fvg.raidx2 := time
fvg.raidy := low
fvg.raidcs := chart.fg_color
else
if low <= fvg.raidy and fvg.active == false and not fvg.isbb
fvg.active := true
fvg.raidx2 := time
else
if fvg.active == false and not fvg.isbb
fvg.raidx2 := time
for in brFVG
if not fvg.israid and not fvg.isbb
if high > fvg.btm and close < fvg.btm and not fvg.isbb
fvg.israid := true
fvg.raidloc := time
fvg.raidy := high
fvg.raidx2 := time
fvg.raidcs := chart.fg_color
else
if high >= fvg.raidy and fvg.active == false and not fvg.isbb
fvg.active := true
fvg.raidx2 := time
else
if fvg.active == false and not fvg.isbb
fvg.raidx2 := time
if barstate.islast
if blFVG.size() > 0 and fvg_num > 0
for i = 0 to math.min(fvg_num - 1, blFVG.size() - 1)
fvg = blFVG.get(i)
dispFVG(fvg, i, true)
if brFVG.size() > 0 and fvg_num > 0
for i = 0 to math.min(fvg_num - 1, brFVG.size() - 1)
fvg = brFVG.get(i)
dispFVG(fvg, i, false)
structure(color upcss, color dncss, bool draw, bool internal, int limit) =>
var structure ms = structure.new(start = 0)
var ob blob = array.new< ob >()
var ob brob = array.new< ob >()
var drawms bldw = array.new< drawms >()
var drawms brdw = array.new< drawms >()
var sellbuyside sellside = array.new()
var sellbuyside buyside = array.new()
bool crossup = false
bool crossdn = false
var float up = na
var float dn = na
idbull = ms.find(false, false, true)
idbear = ms.find(true , false, true)
btmP = obmode == "Length" ? (high - 1 * atr ) < low ? low : (high - 1 * atr ) : low
topP = obmode == "Length" ? (low + 1 * atr ) > high ? high : (low + 1 * atr ) : high
atr = ta.atr (200)
buy = low + atr
sel = high - atr
ph = ta.pivothigh(high, mslen, mslen)
pl = ta.pivotlow (low , mslen, mslen)
var int phn = array.new< int >(1, na)
var int pln = array.new< int >(1, na)
var float php = array.new(1, na)
var float plp = array.new(1, na)
if internal
blob.clear()
brob.clear()
if ph
phn.unshift(bar_index )
php.unshift(high )
if pl
pln.unshift(bar_index )
plp.unshift(low )
if php.size() > 0
if high > php.get(0)
php.clear()
phn.clear()
if plp.size() > 0
if low < plp.get(0)
plp.clear()
pln.clear()
if na(up)
up := high
if na(dn)
dn := low
if high > up
up := high
dn := low
crossup := true
if low < dn
up := high
dn := low
crossdn := true
if ms.start == 0
ms := structure.new(bar_index, na, high, low , bar_index, bar_index, 0, 1, na, bar_index)
if draw
bldw.unshift(drawms.new(time, time, high , "CHoCH" , upcss, line.style_dashed))
brdw.unshift(drawms.new(time, time, low , "CHoCH" , dncss, line.style_dashed))
ms.upsweep := false
ms.dnsweep := false
if ms.start == 1
switch
low <= ms.choch and close >= ms.choch and buildsweep =>
ms.dnsweep := true
ms.choch := low
ms.xloc := bar_index
if draw
dw = brdw.get(0)
dw.x2 := time
dw.style := line.style_dotted
dw.txt := "x"
brdw.unshift(
drawms.new(
time
, time
, low
, "CHoCH"
, dncss
, line.style_dashed
)
)
high >= ms.bos and close <= ms.bos and buildsweep =>
ms.upsweep := true
ms.bos := high
ms.xloc := bar_index
if draw
dw = bldw.get(0)
dw.x2 := time
dw.style := line.style_dotted
dw.txt := "x"
bldw.unshift(
drawms.new(
time
, time
, high
, "CHoCH"
, upcss
, line.style_dashed
)
)
close <= ms.choch =>
ms.txt := "choch"
lc.start := true
lc.count := 0
blob.fnOB(true, topP, idbull)
ms.trend := -1
ms.choch := ms.bos
ms.bos := na
ms.start := 2
ms.loc := bar_index
ms.main := low
ms.temp := ms.loc
ms.xloc := bar_index
if draw
dw = brdw.get(0)
dw.x2 := time
dw.style := internal ? line.style_dashed : line.style_solid
close >= ms.bos =>
ms.txt := "choch"
lc.start := true
lc.count := 0
brob.fnOB(false, btmP, idbear)
ms.trend := 1
ms.choch := ms.choch
ms.bos := na
ms.start := 2
ms.loc := bar_index
ms.main := high
ms.temp := ms.loc
ms.xloc := bar_index
if draw
dw = bldw.get(0)
dw.x2 := time
dw.style := internal ? line.style_dashed : line.style_solid
if ms.start == 2
switch ms.trend
-1 =>
if low <= ms.main
ms.main := low
ms.temp := bar_index
if bar_index % mslen * 2 == 0
if not na(ms.bos) and msmode == "Adjusted Points" and php.size() > 0
if php.get(0) < ms.choch
// ms.xloc := phn.get(0)
ms.choch := php.get(0)
ms.loc := phn.get(0)
ms.xloc := phn.get(0)
ms.temp := phn.get(0)
if draw
choch = bldw.get(0)
choch.x1 := time
choch.x2 := time
choch.y := php.get(0)
if na(ms.bos)
if crossup and close > open and close > open
ms.bos := ms.main
ms.loc := ms.temp
ms.xloc := ms.loc
if draw
brdw.unshift(
drawms.new(
time
, time
, low
, "BOS"
, dncss
, line.style_dashed
)
)
if not na(ms.bos) and draw
dw = brdw.get(0)
dw.x2 := time
if draw
choch = bldw.get(0)
choch.x2 := time
switch
low <= ms.bos and close >= ms.bos and not na(ms.bos) and buildsweep =>
ms.dnsweep := true
ms.bos := low
if draw
dw = brdw.get(0)
dw.x2 := time
dw.style := line.style_dotted
dw.txt := "x"
brdw.unshift(
drawms.new(
time
, time
, low
, "BOS"
, dncss
, line.style_dashed
)
)
ms.xloc := bar_index
close <= ms.bos and not na(ms.bos) =>
ms.txt := "bos"
ms.zz := ms.bos
ms.zn := bar_index
lc.start := true
lc.count := 0
brob.fnOB(false, btmP, idbear)
id = ms.find(true, false, false)
ms.xloc := bar_index
ms.bos := na
ms.choch := high
ms.loc := bar_index
if draw
dw = brdw.get(0)
dw.x2 := time
dw.style := internal ? line.style_dashed : line.style_solid
choch = bldw.get(0)
choch.x1 := time
choch.x2 := time
choch.y := high
switch
high >= ms.choch and close <= ms.choch and buildsweep =>
ms.upsweep := true
ms.choch := high
ms.xloc := bar_index
if draw
dw = bldw.get(0)
dw.x2 := time
dw.style := line.style_dotted
dw.txt := "x"
bldw.unshift(
drawms.new(
time
, time
, high
, "CHoCH"
, upcss
, line.style_dashed
)
)
close >= ms.choch =>
ms.txt := "choch"
ms.zz := ms.choch
ms.zn := bar_index
lc.start := true
lc.count := 0
blob.fnOB(true, topP, idbull)
id = ms.find(false, false, false)
switch
na(ms.bos) =>
ms.choch := low
if draw
brdw.unshift(
drawms.new(
time
, time
, low
, "BOS"
, dncss
, line.style_dashed
)
)
choch = brdw.get(0)
choch.x1 := time
=> ms.choch := ms.bos//low < low ? low : low
ms.bos := na
ms.main := high
ms.trend := 1
ms.loc := bar_index
ms.xloc := bar_index
ms.temp := ms.loc
if draw
dw = bldw.get(0)
dw.x2 := time
dw.txt := "CHoCH"
dw.style := internal ? line.style_dashed : line.style_solid
choch = brdw.get(0)
choch.x2 := time
choch.y := ms.choch
choch.txt := "CHoCH"
ms.xloc := bar_index
blarea.normal := false
1 =>
if high >= ms.main
ms.main := high
ms.temp := bar_index
if na(ms.bos)
if crossdn and close < open and close < open
ms.bos := ms.main
ms.loc := ms.temp
ms.xloc := ms.loc
if draw
bldw.unshift(
drawms.new(
time
, time
, high
, "BOS"
, upcss
, line.style_dashed
)
)
if bar_index % mslen * 2 == 0
if not na(ms.bos) and msmode == "Adjusted Points" and plp.size() > 0
if plp.get(0) > ms.choch
// ms.xloc := pln.get(0)
ms.choch := plp.get(0)
ms.loc := pln.get(0)
ms.xloc := pln.get(0)
ms.temp := pln.get(0)
// ms.loc := pln.get(0)
if draw
choch = brdw.get(0)
choch.x1 := time
choch.x2 := time
choch.y := plp.get(0)
if not na(ms.bos) and draw
dw = bldw.get(0)
dw.x2 := time
if draw
choch = brdw.get(0)
choch.x2 := time
switch
high >= ms.bos and close <= ms.bos and not na(ms.bos) and buildsweep =>
ms.upsweep := true
ms.bos := high
if draw
dw = bldw.get(0)
dw.x2 := time
dw.style := line.style_dotted
dw.txt := "x"
bldw.unshift(
drawms.new(
time
, time
, high
, "BOS"
, upcss
, line.style_dashed
)
)
ms.xloc := bar_index
close >= ms.bos and not na(ms.bos) =>
ms.txt := "bos"
ms.zz := ms.bos
ms.zn := bar_index
lc.start := true
lc.count := 0
blob.fnOB(true, topP, idbull)
id = ms.find(false, false, false)
ms.xloc := bar_index
ms.bos := na
ms.choch := low
ms.loc := bar_index
if draw
dw = bldw.get(0)
dw.x2 := time
dw.style := internal ? line.style_dashed : line.style_solid
choch = brdw.get(0)
choch.x1 := time
choch.x2 := time
choch.y := low
switch
low <= ms.choch and close >= ms.choch and buildsweep =>
ms.dnsweep := true
ms.choch := low
ms.xloc := bar_index
if draw
dw = brdw.get(0)
dw.x2 := time
dw.style := line.style_dotted
dw.txt := "x"
brdw.unshift(
drawms.new(
time
, time
, low
, "CHoCH"
, dncss
, line.style_dashed
)
)
close <= ms.choch =>
ms.txt := "choch"
ms.zz := ms.choch
ms.zn := bar_index
lc.start := true
lc.count := 0
brob.fnOB(false, btmP, idbear)
id = ms.find(true, false, false)
switch
na(ms.bos) =>
ms.choch := high
if draw
bldw.unshift(
drawms.new(
time
, time
, high
, "BOS"
, upcss
, line.style_dashed
)
)
choch = bldw.get(0)
choch.x1 := time
=> ms.choch := ms.bos//high > high ? high : high
ms.bos := na
ms.main := low
ms.trend := -1
ms.loc := bar_index
ms.temp := ms.loc
if draw
dw = brdw.get(0)
dw.x2 := time
dw.txt := "CHoCH"
dw.style := internal ? line.style_dashed : line.style_solid
choch = bldw.get(0)
choch.y := ms.choch
choch.x2 := time
choch.txt := "CHoCH"
ms.xloc := bar_index
if blob.size() > 0
ob = blob.get(0)
if not ob.isbb
if low < ob.top
if blobenter.normal == false
blobenter.normal := true
else
if high > ob.btm
if blobenter.breaker == false
blobenter.breaker := true
if brob.size() > 0
ob = brob.get(0)
if not ob.isbb
if high > ob.btm
if brobenter.normal == false
brobenter.normal := true
else
if low < ob.top
if brobenter.breaker == false
brobenter.breaker := true
if obshow and oblast > 0
if barstate.isconfirmed
blob.mitigated()
brob.mitigated()
if overlap
overlap(blob, brob)
if blob.size() > 0
for in blob
metric.umt()
if brob.size() > 0
for in brob
metric.umt()
if barstate.islast
if blob.size() > 0
for i = 0 to math.min(oblast - 1, blob.size() - 1)
obs = blob.get(i)
display(obs, blob, i)
if brob.size() > 0
for i = 0 to math.min(oblast - 1, brob.size() - 1)
obs = brob.get(i)
display(obs, brob, i)
if barstate.islast and draw and bldw.size() > 0 and brdw.size() > 0
for i = 0 to bldw.size() - 1
obj = bldw.get(i)
if i <= limit
bin.ln.unshift(
line.new(
x1 = obj.x1
, x2 = obj.x2
, y1 = obj.y
, y2 = obj.y
, color = obj.css
, style = obj.style
, xloc = xloc.bar_time
)
)
bin.lb.unshift(
label.new(
x = int(math.avg(bin.ln.get(0).get_x1(), bin.ln.get(0).get_x2()))
, y = obj.y
, xloc = xloc.bar_time
, color = #ffffff00
, style = label.style_label_down
, textcolor = obj.css
, size = mstext.txSz()
, text = obj.txt
)
)
if msbubble
bin.lb.unshift(
label.new(
x = obj.x1
, y = obj.y
, xloc = xloc.bar_time
, color = color.new(obj.css, 80)
, style = label.style_circle
, size = size.tiny
)
)
for i = 0 to brdw.size() - 1
obj = brdw.get(i)
if i <= limit
bin.ln.unshift(
line.new(
x1 = obj.x1
, x2 = obj.x2
, y1 = obj.y
, y2 = obj.y
, color = obj.css
, style = obj.style
, xloc = xloc.bar_time
)
)
bin.lb.unshift(
label.new(
x = int(math.avg(bin.ln.get(0).get_x1(), bin.ln.get(0).get_x2()))
, y = obj.y
, xloc = xloc.bar_time
, color = #ffffff00
, style = label.style_label_up
, textcolor = obj.css
, size = mstext.txSz()
, text = obj.txt
)
)
if msbubble
bin.lb.unshift(
label.new(
x = obj.x1
, y = obj.y
, xloc = xloc.bar_time
, color = color.new(obj.css, 80)
, style = label.style_circle
, size = size.tiny
)
)
ms
//}
_ ='
------------
–––––––––––––––––––––––––– EXECUTION –––––––––––––––––––––––––––
------------ '//{
structure ms = na
if windowsis
if (bar_index > last_bar_index - mswindow)
ms := structure(swingcssup , swingcssdn , showSwing , false, swingLimit)
if windowsis == false
ms := structure(swingcssup , swingcssdn , showSwing , false, swingLimit)
// if showInternal and inZone
// structure ims = structure(interncssup, interncssdn, showInternal, true , swingLimit)
color css = na
method darkcss(color css, float factor) =>
blue = color.b(css) * (1 - factor)
red = color.r(css) * (1 - factor)
green = color.g(css) * (1 - factor)
color.rgb(red, green, blue, 0)
if windowsis ? (bar_index > last_bar_index - mswindow) : true
css := ms.trend == 1 ? swingcssup : swingcssdn
css := (ms.txt == "bos" ? css : css.darkcss(0.3))
barcolor(candlecss ? css : na)
if fvg_enable
dFVG()
if showMapping
mapping()
var phl = Zphl.new(
na
, na
, label.new(na , na , color = invcol , textcolor = swingcssdn , style = label.style_label_down , size = size.tiny , text = "")
, label.new(na , na , color = invcol , textcolor = swingcssup , style = label.style_label_up , size = size.tiny , text = "")
, true
, true
, true
, true
, ""
, ""
, 0
, 0
, 0
, 0
, high
, low
, 0
, 0
, 0
, 0
, 0
, 0
, na
, na
)

Price Action [False Break+BreakOut] This indicator is designed to analyze Price Action with a focus on identifying Pivot Points and detecting Breakout and False Break signals.
Key Features:
Pivot Point Detection
Identifies Pivot High and Pivot Low points
Classifies Pivot Points into:
Higher High (HH)
Lower High (LH)
Higher Low (HL)
Lower Low (LL)
Visual Display Options
Pivot point markers (triangles)
Price values at pivot points
Support/Resistance level lines
Fractal Chaos Channel display
Average of Pivot High/Low
False Break Detection
Detects False Break signals
Customizable validation period (1-10 bars)
Option to include candle shadows in engulfing detection
Displays "FalseB!!" labels when detected
Color-coded signals (red for false break up, green for false break down)
Breakout Signals
Shows Breakout (⬆️) and Breakdown (⬇️) signals
Alert conditions for all signal types
Tracks recent breakout/breakdown levels
Main Configuration Settings:
Source data and length parameters for pivot detection
Selective display of different pivot types
Maximum bars to display
Support/Resistance level extension length
Text size customization
Technical Implementation:
Uses ta.pivothigh() and ta.pivotlow() for pivot detection
Implements bar counting for level persistence
Engulfing pattern detection for false breaks
Color-coded visual elements (teal for HH/HL, red for LH/LL)
Comprehensive alert system
Usage:
This indicator is ideal for traders using Price Action strategies, helping to identify trend reversal points, key Support/Resistance levels, and potential genuine/false breakout signals for better trade entries and exits.

Fractal Strength OscillatorThe Fractal Strength Oscillator Indicator combines the Relative Strength Index (RSI) and Fractal Dimension Index (FDI) to identify market momentum and trend direction. By integrating RSI's momentum signals with FDI's fractal-based trend analysis, this indicator provides clear visual cues for bullish and bearish conditions through colored plots and price bars.
How It Works
RSI Calculation: Computes RSI based on a user-selected price source (default: Close) over a configurable period. Optional smoothing with various moving average types (e.g., SMA, EMA, ALMA) enhances signal clarity.
FDI Calculation: Measures market complexity using a fractal dimension over a user-defined period (default: 20). A threshold (default: 1.45) determines trend strength.
Trend Logic
Bullish Signal: RSI > 55 or FDI < threshold indicates upward momentum
Bearish Signal: RSI < 45 or FDI > threshold indicates downward momentum
Customization & Parameters
RSI Parameters: RSI length, smoothing option , MA type, MA length, ALMA sigma
FDI Parameters: FDI length, trend threshold.
Trading Applications
Momentum Trading: Use RSI and FDI signals for entry/exit points.
Trend Confirmation: Bar coloring aligns with trend signals.
Reversal Detection: Identify shifts when RSI or FDI crosses thresholds
Final Note
The Fractal Strength Oscillator Indicator is a straightforward tool for traders seeking momentum and trend insights. Its combination of RSI, FDI, and visual cues supports informed trading decisions. Backtest thoroughly and use within a broader strategy. This indicator is for educational purposes and not financial advice.
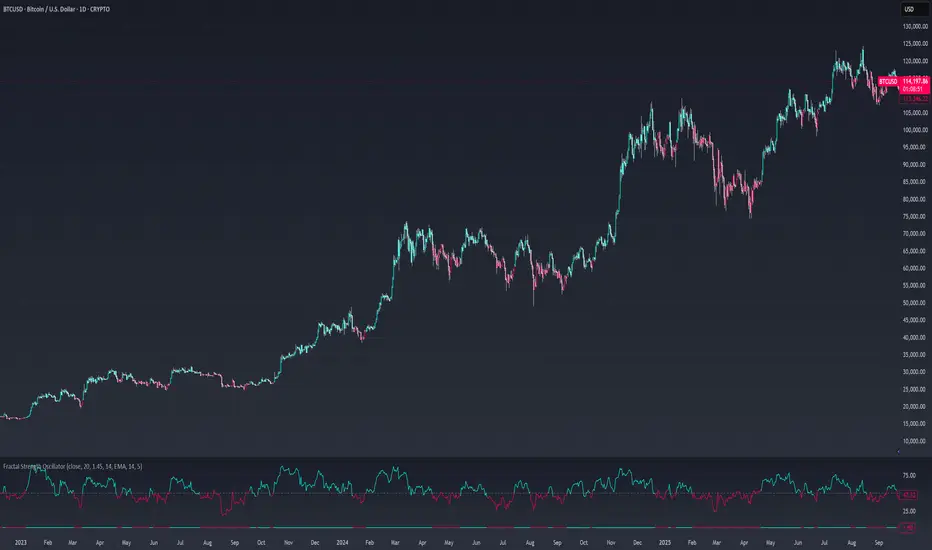
CQ_MTF Calculated Target Price Lines [BITCOIN HOY]
Comprehensive Indicator Script Overview
Fully Automatic Intraday, Four Hour, Daily, and Weekly Calculated Price Target Lines —A Versatile Tool for Traders.
Welcome to a powerful and flexible indicator script designed to enhance your trading experience across multiple timeframes.
This script empowers users to interactively set, visualize, and manage price targets, entries, and objectives for both
short-term and long-term trading strategies. Whether you are a day trader seeking to mark crucial intraday levels or a
long-term investor planning strategic entries, this tool offers an all-encompassing solution.
Key Features
• Multi-Time Frame Price Target Lines: Calculated price targets for Intraday, Four Hour, Daily, and Weekly periods,
ensuring you always have a clear view of the market objectives at every scale.
• Long-Term Investment Entry Events: Document and display significant entry events for long-term investments, helping
you maintain a strategic perspective while navigating short-term fluctuations.
• Long-Term Price Objectives: Input and track price objectives for your long-term trades, supporting your investment
decisions with clearly visualized milestones.
• Customizable Labels and Lines: Each price target is accompanied by clearly labeled lines, making it easy to distinguish
between timeframes and targets at a glance.
Optional Price Gauge for Intraday Dynamics
For users who wish to monitor real-time market sentiment, the script includes an optional price gauge. This dynamic
feature tracks intraday price movement, providing visual cues to quickly assess whether the prevailing tendency is
bullish or bearish. The intuitive gauge aids in confirming your intraday strategies or alerting you to potential reversals.
User Experience and Customization
• Interactive Inputs: All key parameters—price targets, x-axis prices, entry events, and objectives—are entered manually
by the user. This approach ensures the script adapts to your personal analysis and trading methodology.
• Easy Visualization: The clear display of lines, labels, and the optional gauge streamlines your chart, making it easier
to make informed decisions at a glance.
• Flexible Application: Whether you’re trading short-term swings or building positions for the long haul, the indicator
integrates seamlessly into your workflow.
How to Use
• The script automatically calculates price targets for each timeframe (Intraday, Four Hour, Daily, and Weekly).
• Automatically calculates intra-month price objectives for quick reference and planning.
• To monitor current market momentum, activate the price gauge and follow the visual cues for bullish or bearish trends.
Benefits
• Comprehensive Market Overview: Simultaneously track multiple timeframes and objectives, keeping all critical information at your fingertips.
• Improved Decision Making: Visual clarity and strategic labeling support faster, more confident trading decisions.
• Customizable and Adaptable: Tailor the script to your unique trading style and analytical approach.
Enjoy using the indicator, and happy trading! Let this versatile tool be your companion in navigating the ever-changing
tides of the market.

HA + EMA Entry/Exit (First Wick Candle Exit)Strategy Logic -
Entry Signals:
BUY: HA candle crosses above 50 EMA
SELL: HA candle crosses below 50 EMA
Exit Signals:
Exit Long: After a BUY, trigger when:
HA candle is solid red (haClose < haOpen)
Candle has a lower wick (haLow < haClose)
Exit Short: After a SELL, trigger when:
HA candle is solid green (haClose > haOpen)
Candle has an upper wick (haHigh > haClose)
Updated -
After a BUY signal:
Look for a red Heikin Ashi candle (haClose < haOpen)
It must have only a lower wick:
✅ haLow < haClose (lower wick exists)
✅ haHigh == haOpen (no upper wick)
After a SELL signal:
Look for a green Heikin Ashi candle (haClose > haOpen)
It must have only an upper wick:
✅ haHigh > haClose (upper wick exists)
✅ haLow == haOpen (no lower wick)

RSI Divergence (CompactFX)You can now display divergences in the RSI.
In addition, the following features have been added:
- You can change the color of the RSI value when it crosses 50.
- You can display pivots for any period.
- You can display RSI for higher or lower time frames.
- You can change the color of various parts of the chart, so you can customize it to your liking and avoid boring charts.

AI Agent PRIMEFLOW v1AI Agent PRIMEFLOW v1 — Trend + Breakout + Smart Stops
*By AI Agent Community*
## Overview
PRIMEFLOW v1 is a clean, rules-based signal tool that fires only when **trend + regime + market structure** align.
It combines a **baseline trend**, a **volatility regime filter** (ATR z-score), and **Donchian breakouts**, with **ATR bands** and **Chandelier-style stops** for risk control. Optional **HTF confirmation** keeps entries in sync with higher-timeframe bias.
> Built from public trading concepts (EMA/KAMA/HMA baselines, Donchian breakout, ATR trailing). No proprietary code used.
---
## What it does (3-Layer Confirmation)
1. **Trend** – EMA50/200 relationship + user-selectable baseline (EMA/HMA/KAMA).
2. **Regime** – ATR% z-score filter reduces chop; “Conservative/Balanced/Aggressive” modes adjust threshold.
3. **Structure** – Donchian breakout confirms momentum beyond recent range.
Only when all three align do BUY/SELL labels appear. ATR bands and dynamic stops are plotted for exits and trailing.
---
## Signals & Risk
* **Long**: Trend up (EMA50>EMA200), regime trending, price crosses above baseline **and** breaks the prior Donchian high.
* **Short**: Mirror conditions to the downside.
* **Stops**: Auto-plotted **Long/Short Stop** (ATR-based, Chandelier-style).
* **Targets**: Consider 1.5–2× ATR or ATR bands; keep a runner with trailing stop.
---
## Inputs (key)
* **Signal Mode**: Conservative / Balanced / Aggressive (regime threshold).
* **Use Heikin Ashi Source** (optional smoothing).
* **Structure Lookback (Donchian)**.
* **Volatility Lookback** (for ATR z-score).
* **Baseline Type & Length**: EMA / HMA / KAMA.
* **Trend Filter EMAs**: Fast (default 50) vs Slow (default 200).
* **HTF Confirmation**: set a higher TF (blank = off).
* **ATR Length & Multiplier** (bands & stops).
* **Style toggles**: Bands, regime background, labels.
---
## Recommended Presets
**XAUUSD – M15 (scalping/intraday)**
* Mode: *Balanced* · Baseline: *EMA 50* · Donchian: *20* · ATR: *10 × 2.5* · HTF: *H1*.
**XAUUSD – H1 (intraday)**
* Baseline: *KAMA 50* · Donchian: *25* · ATR: *14 × 2.5* · HTF: *H4*.
**BTCUSDT – H1 (crypto)**
* Baseline: *EMA 100* · Donchian: *30* · ATR: *14 × 2.0* · HTF: *H4* · Mode: *Conservative* in chop.
---
## Alerts (ready)
Create alerts **Once Per Bar Close**:
* **PRIMEFLOW Long** – long entry condition met.
* **PRIMEFLOW Short** – short entry condition met.
* **Trail Flip (Long)** – long trailing stop flips (exit/trim).
* **Trail Flip (Short)** – short trailing stop flips.
Tip: Route alerts to your bot/Telegram/WA webhook. Include placeholders (e.g., `{{ticker}} | {{interval}} | {{close}} | LONG/SHORT | SL: {{plot("Long Stop")}}`).
---
## Best Practices
* Avoid taking breakouts that are **>1.5× ATR** away from baseline (overextended).
* Re-enter on pullbacks while trend & regime remain valid.
* Around high-impact news (NFP/FOMC), wait 15–30 minutes after release.
* Use **HTF 4×** your chart TF (e.g., M15→H1, H1→H4).
---
## Who it’s for
Swing/scalp traders who want higher-quality trend entries with **built-in structure confirmation** and **clear risk lines**, especially on **XAUUSD** and **BTC**.
---
## Notes
* This is an **indicator** (not a strategy). A strategy/backtest version can be provided.
* Educational purposes only. Not financial advice. Trading involves risk.
**Tags:** trend, breakout, ATR, Donchian, chandelier stop, regime filter, XAUUSD, BTC, scalping, intraday, multi-timeframe, heikin ashi
**Changelog**
v1.0 – Initial release: 3-Layer Confirmation, ATR bands/stops, HTF bias, 4 alerts.

CRT (Candle Range Theory)+ Daily Bias - Milana Trades Overview
This indicator combines Candle Range Theory (CRT) with a Daily & Weekly Bias model, providing traders with both short-term CRT candle detection and higher-timeframe directional context. It is designed to help traders identify liquidity traps, potential reversals, and overall market bias in a structured and visual way.
🔹 1. Candle Range Theory (CRT)
The CRT module focuses on detecting CRT candles (false breakouts) and marking key high/low ranges.
Bullish CRT :
Occurs when the price makes a lower low compared to the previous candle but closes bullish (close > open).
→ Signals potential upside reversal.
Bearish CRT :
Occurs when the price makes a higher high compared to the previous candle but closes bearish (close < open).
→ Signals potential downside reversal.
When a CRT is detected:
The indicator plots dotted lines and levels from the trap candle’s high/low.
Labels (CRT, CRT H, CRT L) are drawn for easy visualization.
Previous CRT levels/labels can be cleared automatically if desired.
Alerts are triggered once a trap is confirmed (on candle close).
🔹 2. Daily & Weekly Bias
The bias model provides directional context based on daily and weekly candle close
Bias is determined by analyzing:
Breaks of previous highs/lows.
Failed breaks (false moves beyond prior levels).
Inside bars (neutral conditions).
Possible Bias States:
The logic Daily BIAS
Close Above PDH → BULLISH
Close Below PDL → BEARISH
Failed Close Above → BEARISH
Failed Close Below → BULLISH
Inside Range → NEUTRAL
Both Daily and Weekly bias are calculated and displayed in a structured table.
⚠️ Important Note on Daily Bias
The Daily Bias provided by this indicator should be treated as a technical reference, not an absolute signal. Market structure is complex, and automatic bias detection may not always capture context such as news events, liquidity zones, or higher-timeframe confluence.
👉 Always prioritize your own market analysis and discretion over the indicator’s bias. Use the Daily/Weekly bias as a guideline to support your view, rather than as a rule to follow blindly.
🔹 3. Bias Table
A clean on-chart table (top-right corner by default) displays:
Timeframe (Daily / Weekly).
Current bias (Bullish, Bearish, Neutral).
The table is fully customizable:
Colors (header, text, row backgrounds).
Option to show/hide Daily or Weekly bias.
🔹 4. Alerts
The indicator supports real-time alerts:
Bearish CRT detected
Bullish CRT detected
These alerts trigger only on confirmed candle closes, ensuring reliable signals.
🔹 5. Settings
CRT Module
Length → How many bars CRT levels extend.
Clear Broken → Automatically clear past CRT lines when a new trap is detected.
Trap Candle Colors → Define bullish/bearish trap highlight colors.
CRT Line/Label Styling → Customize line style, width, label size, and text/background colors.
Bias Module
Show Table → Enable/disable bias table.
Show Daily / Show Weekly Bias → Toggle specific timeframes.
Colors → Set bullish, bearish, and neutral bias colors.
Table Styling → Customize background, border, header, and row colors.
🔹 6. How to Use
Look for trap candle signals (CRT labels) near important liquidity levels.
Use the Daily & Weekly bias table to confirm whether the broader trend supports the trap signal.
Align CRT signals with bias direction for higher-probability setups.
Use alerts to stay notified of trap events without monitoring the chart constantly.
See the levels. Feel the flow

