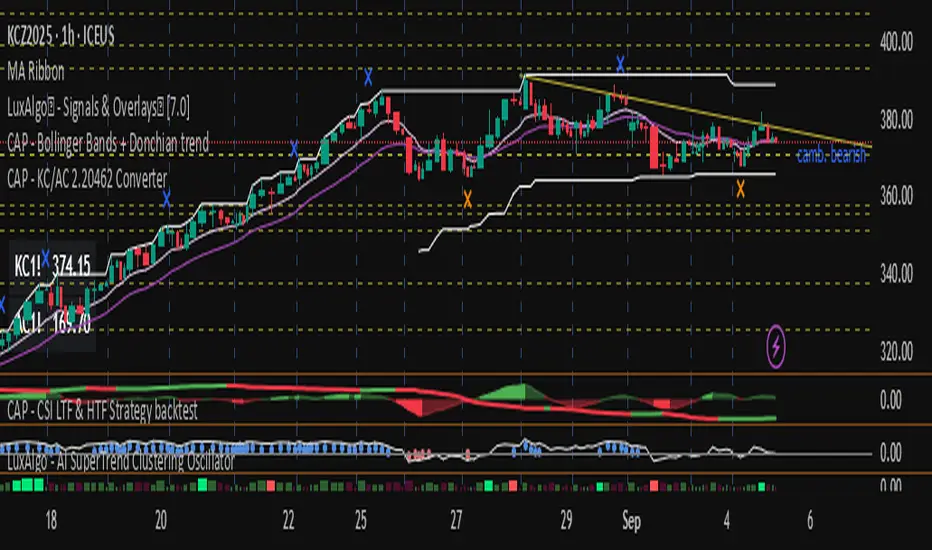
CAP - KC/AC 2.20462 Converter// ───────────────────────────────────────────────────────────────────────────────
// Purpose: Conversion Indicator for ICE “C” (KC) and “C Metric” (AC) Contracts
//
// Background:
// - The Intercontinental Exchange (ICE) is phasing out the legacy Coffee “C” contract (symbol: KC),
// which has been quoted in U.S. cents per pound, and replacing it with the new Coffee “C Metric” contract (symbol: AC),
// quoted in U.S. dollars per metric ton :contentReference {index=0}.
// - The final KC futures expire in March 2028; AC contracts begin trading in September 2025 and use modern specifications
// including pricing per metric ton and flexible bulk delivery formats :contentReference {index=1}.
//
// Why this script matters:
// - Traders are accustomed to the KC pricing format (¢/lb); the AC contract’s USD/MT may create confusion.
// - This indicator visually converts the current chart price—whether from KC or AC contracts—directly into its equivalent unit,
// helping traders quickly assess parity and compare trends across both contract types.
// - It simplifies head-to-head comparison during this transition period, improving clarity on chart price behavior.
//
// Usage instructions:
// - If the symbol starts with "KC", the script divides the price by 2.20462 to convert from ¢/lb to approximate ¢/kg.
// - If the symbol starts with "AC", the script multiplies the price by 2.20462 to reverse the conversion.
// - The results (converted values) are displayed in a table for immediate visual clarity.
// ───────────────────────────────────────────────────────────────────────────────
Сельскохозяйственные фьючерсы
Williams Percent Range with Trendlines and BreakoutsHere is my "Williams Percent Range with Trendlines and Breakouts" indicator, a simple yet powerful tool for traders. This indicator combines the classic Williams %R oscillator, which helps identify overbought and oversold levels, with added trendlines for easier trend analysis at a glance.
It's designed to make spotting potential breakouts easier by drawing attention to significant price movements. With customizable settings for the Williams %R period and trendline sensitivity, it's a flexible tool for various symbols and trading styles.
Whether you're looking to refine your trading strategy or just need a clearer view of market trends, this indicator should offer a straight forward approach to hopefully enhance your trading decisions.
Disclaimer: This indicator is intended for educational and informational purposes only. Always conduct your own research and analysis before making trading decisions.

ILM CFTC COT Disaggregated PlotUse this indicator on Daily Timeframe
Please refer to the below link for CFTC Disaggregated COT
www.cftc.gov
This script is very similar to COT Financial Plot indicator except that it plots the data for Disaggregated Futures

Grains:Backwardation/ContangoGRAINS: Wheat , Soybeans , Corn (ZW, ZS, ZC )
Quickly visualize carrying charge market vs backwardized market by comparing the price of the next 2 years of futures contracts.
Carrying charge (contract prices increasing into the future) = normal, representing the costs of carrying/storage of a commodity. When this is flipped to Backwardation (contract prices decreasing into the future): its a bullish sign: Buyers want this commodity, and they want it NOW.
The above chart shows a nice example of backwardation.
Note: indicator does not map to time axis in the same way as price; it simply plots the progression of contract months out into the future; left to right; so timeframe DOESN'T MATTER for this plot
There's likely some more efficient way to write this; e.g. when plotting for Wheat (ZW); 15 of the security requests are redundant; but they are still made; and can make this slower to load
TO UPDATE(once a year will do): in REQUEST CONTRACTS section, delete old contracts (top) and add new ones (bottom). Then in PLOTTING section, Delete old contract labels (bottom); add new contract labels (top); adjust the X in 'bar_index-(X+_historical)' numbers accordingly
This is one of three similar indicators: Meats | Metals | Grains
-If you want to build from this; to work on other commodities ; be aware that Tradingview limits the number of contract calls to 40 (hence the 3 seperate indicators)
Tips:
-Right click and reset chart if you can't see the plot; or if you have trouble with the scaling.
-Right click and add to new scale if you prefer this not to overlay directly on price. Or move to new pane below.
--Added historical input: input days back in time; to see the historical shape of the Futures curve via selecting 'days back' snapshot
updated 15th June 2022
© twingall
