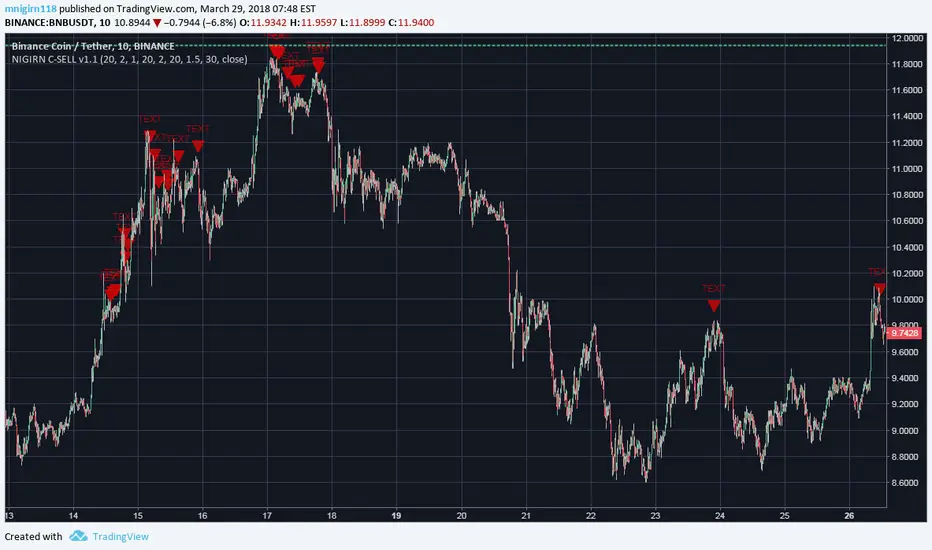
NIGIRN CRYTPO SELL SIGNALER v1.1#####################################
NIGIRN CRYTPO SELL SIGNALER v1.0
-------------------------------------------------
NOTIFIES THE USER VIA AN ALERT 'TEXT' OF POTENTIAL SELL OPPORTUNITIES IN CRYPTOCURRENCY MARKET TYPES. USERS WOULD INDICATE THE ALERTS USING THE CREATE ALERTS FEATURE AVAILABLE IN TRADING VIEW.
INCORPORATES SEVERAL INDICATOR STRATEGIES COMBINED AND ATTEMPTS TO SIGNAL USERS DURING DOWNWARD TRENDS AND AT CLOSING HIGH POINTS. 80% PERCENT SUCCESSFUL AT THIS TIME. USERS WHEN RECEIVING TEXTS ARE ENCOURAGED TO EXAMINE THE CHARTS THEMSELVES TO VERIFY THE SELL. IT IS NOT SUPER TIME SENSITIVE AS IT IS BASED ON LONGER TRENDS & VOLATILITY .
USER MAY CHANGE THE CHART RESOLUTIONS TO FIND THE BEST APPROACH.
DISCLAIMER: TRADING IN CRYPTOCURRENCY IS A RISKY PROPOSITION. HOPEUFLLY THIS WILL HELP BUT, USE AT YOUR OWN RISK.
M. NIGIRN
#####################################
Alert

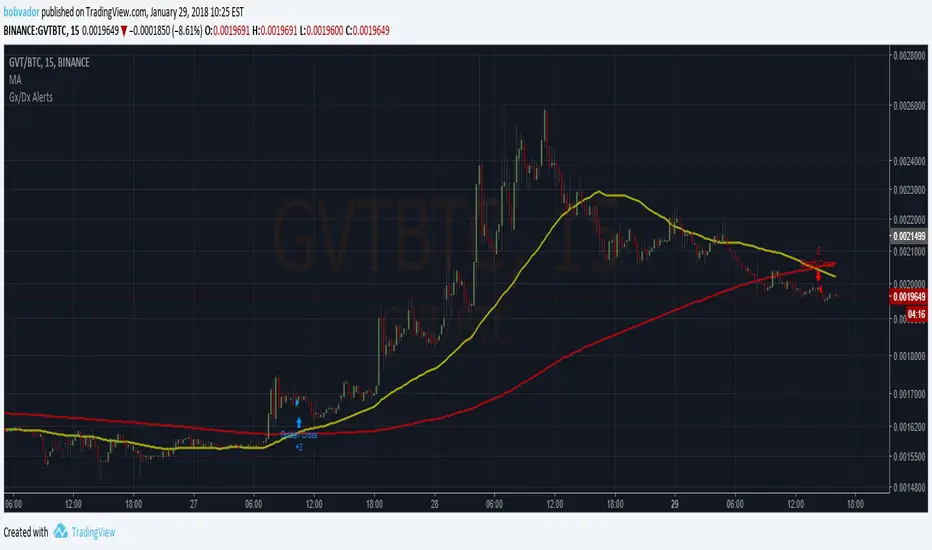
Alerts for Golden/Death CrossesTo use with this strategy/ .
This one enables to set up alerts on TradingView (not possible inside a strategy script)
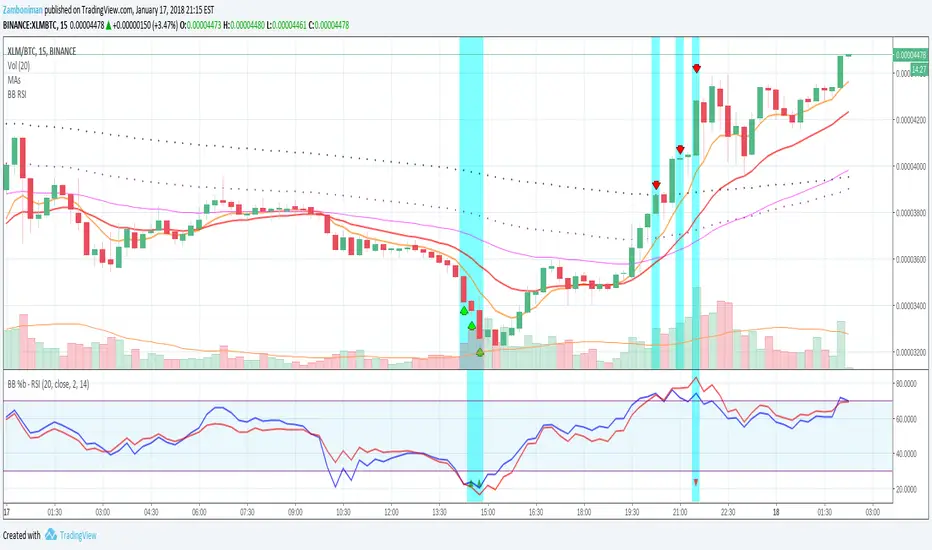
Bollinger Bands %b & RSI & Stochastic Smoothed Indicator & AlertThis indicator displays RSI, a normalized Bollinger Band &b (Usual 0 -1 range of BB normalized to the OBOS range of RSI), and a normalized smoothed Stochastic (again, normalized to the OBOS of RSI) simultaneously with a single indicator.
It also displays buy and sell signals based upon the above.
The stochastic can be turned on and off, and the sell signal calculation will be changed accordingly (Stochastic not used to calculate buy signal).
All periods, OBOS levels, deviation, etc, are user adjustable. The buy and sell arrows can be optionally turned off.
The indicator supports alerts for the buy and sell signals.
This is a considerably rewritten, cleaned up, and updated version of my BB %b & RSI Indicator and Alert with many more features, and including a stochastic.
This indicator is mainly for use with Cryptocurrencies in shorter time periods to display possible trade opportunities. Can also be used with Forex.

BB %b & RSI Indicator & AlertIndicator for displaying both RSI and a normalized Bollinger Bands %b (Usual 0 - 1 range of BB normalized to the 30 - 70 OB/OS range of RSI) simultaneously.
Settable periods for RSI and BB, and settable standard deviation for BB.
When both Bollinger Bands %b and RSI are OB/OS then the column will turn blue and a buy/sell arrow will appear in the indicator provided other conditions pertaining to the OB/OS condition in one of the last two candles are also met.
You can also set an alert on the arrow indicator appearing.
I use this mainly for Cryptocurrencies, though it is usable in Forex, for shorter time periods to indicate possible trade opportunities.
Amazing Crossover System V.1The last grind of today: Amazing Crossover System , which is composed of 2 moving averages( EMA 5 & EMA10) and RSI (Period of 10,source:hl2). This system is created with the purpose of helping swing traders to seek longer-term trading opportunities, and it should only be used with 1-hr/ 4-hr / daily charts.
You can try this and show me some feedback. New version will be released once I find out there are the room to be improved, bugs to be fixed and advice from users.
Less is more. Hope you will find it helpful.

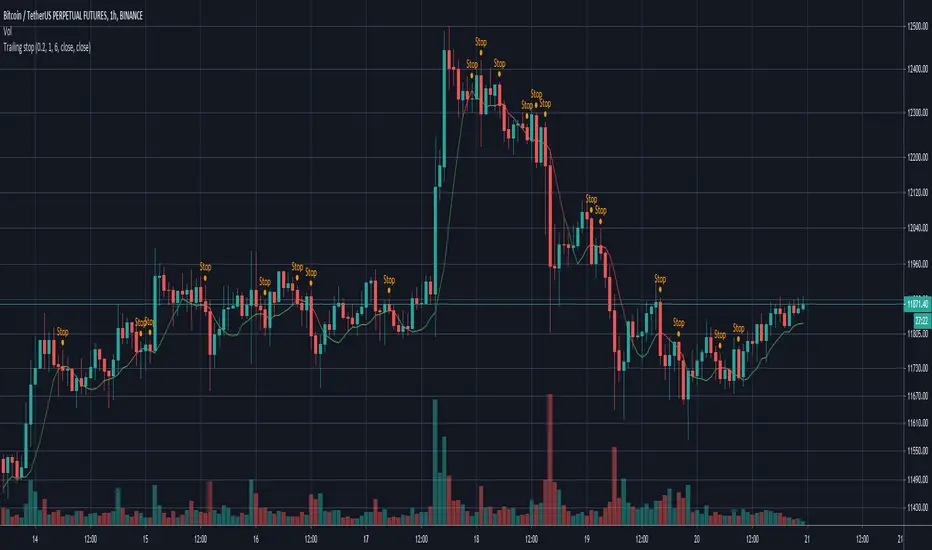
Simple Trailing stopSince my exchange doesn't support trailing stop I made a script for it.
It is fully configurable, which means you can set the bars for calculation, the offset and sources for trigger and calculation.
The original purpose for me was to send a command to my bot. If you like it please comment and check out my other scripts.
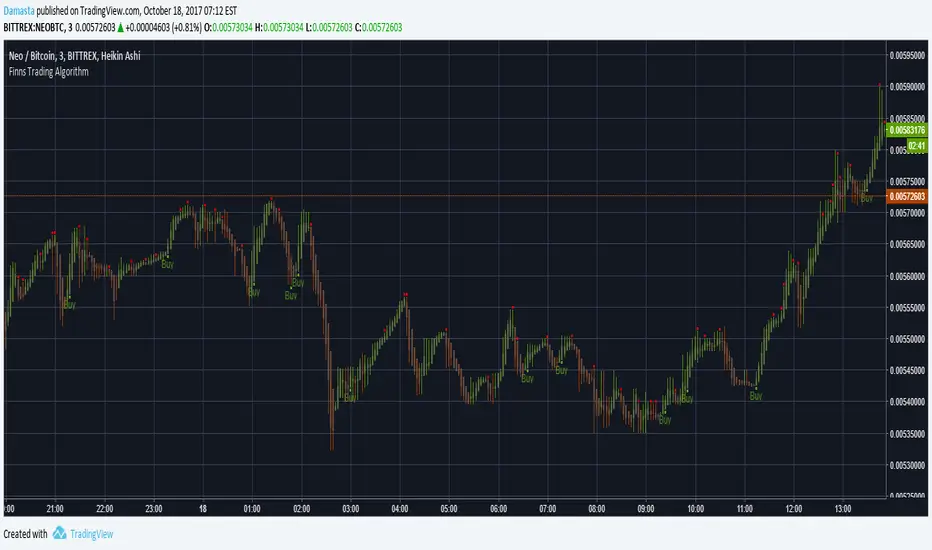
Finns Trading Algorithm AlertsHello there,
I have developed a Microprofit Script for Tradingview and would like to introduce you to it.
First of all some keypoints to it:
-It uses Gunbot
-Many Microtrades on a bullish market
-Even make Profit on Sideway & wavy downtrends
-Double up to infinity
-Controlled downtrend averaging
-Visualizer available allowing visible emulation of the Script & Gunbot trading together.
-More Features & Optimization still to come!

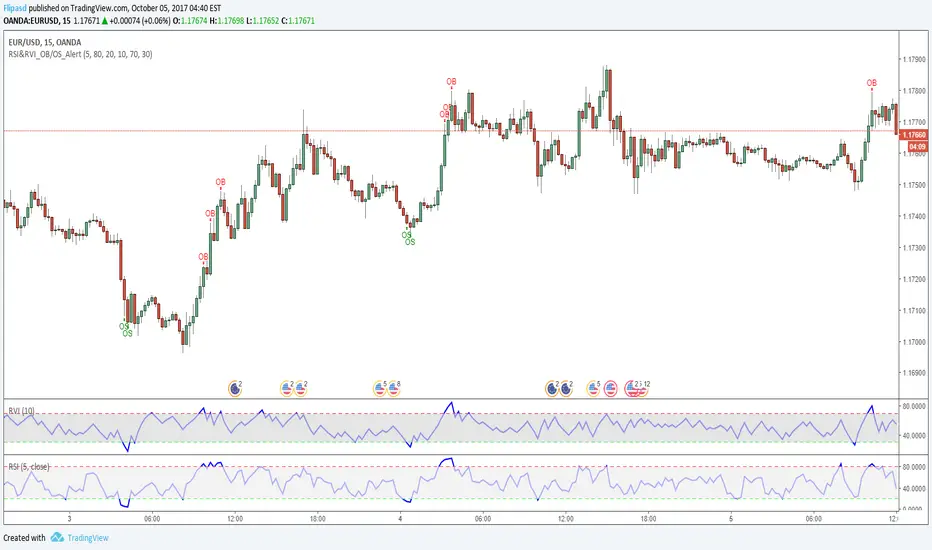
RSI & RVI OB/OS Alert ArrowThe script shows arrows on bars that are in overbought or oversold, based on the set parameters of Relative Strength Index ( RSI ) and Relative Volatility Index (RVI).
Also there is a universal allert, which includes both conditions - overbought and oversold.
You can change the period of RSI and RVI, as well as the upper and lower boundaries of these indicators.
Gunbot MACDgenOk this is just some strat based on MACD, checking for a few conditions until giving buy/sell signals to Gunbot via alerts.
It is generalized but if you want to go play with the values. I will continue to develop this further and am happy to receive feedback.
Notations are coming.
Usage notes:
-ONLY use this with TV_GAIN: 0.6 because on downtrends it is supposed to double up to pull down the average bought price!
-Use "buying condition" and "selling condition" for alerts, trigger on close and I suggest you use 3 min intervals but try what looks good to you
-Use this on pairs that are curvy and have atleast 0.6% gain between buy/sell triggers. This is also general advise when you want to take microprofits.
-Don't be confused with sell arrows, it will only trigger the bot sell on gain when you've set TV_GAIN

420_cci_averages_alertsSup all it is Snoop
Here is a CCI script that does averages of the CCI with many types to choose from. It also has a few alert types which have titles that are pretty self descriptive. I use the alerts as 'once per bar on close'. Hope it helps you!
xoxo
Snoop

SuperTrend V.1 AlertThis script is to use with "SuperTrend V1.0 - Buy or Sell Signal" by Rajandran.r
Use it with original Strategy for add TradingView Alert.
Enjoy!

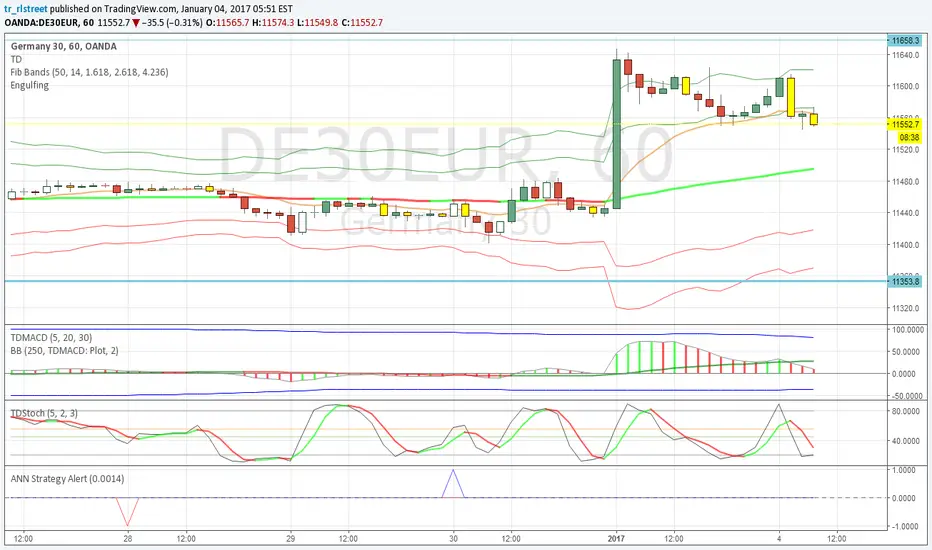
ANN Strategy AlertBased on ANN Strategy by Sirlof2009.
Changed it from strategy to indicator and made appearance less noisy
I use it just for creating alerts (predictionS<0 => Short and predictionL >0 => Long)
Stefan Krecher: Jeddingen Divergence v2This is an update to my script:
Stefan-Krecher-Jeddingen-Divergence/
The behaviour is exactly the same, I just added the option to create alerts based on this indicator

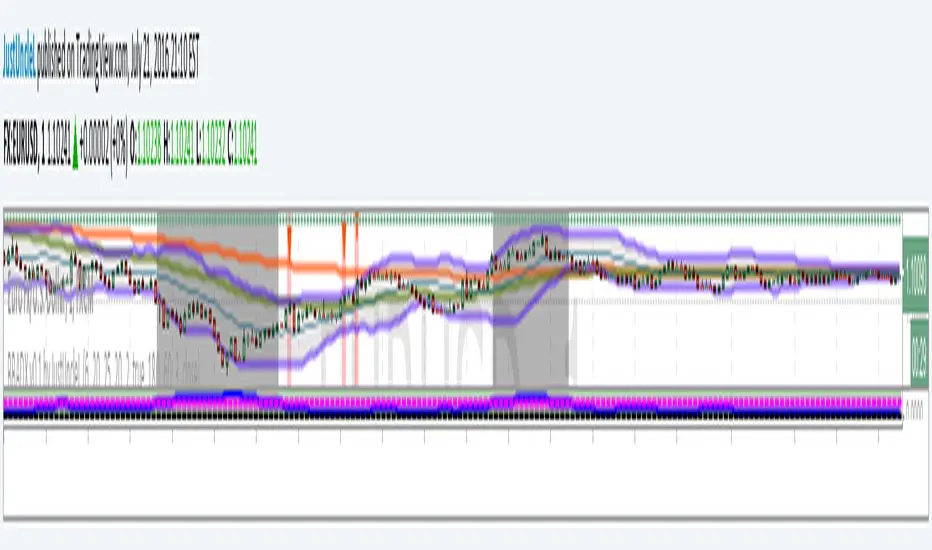
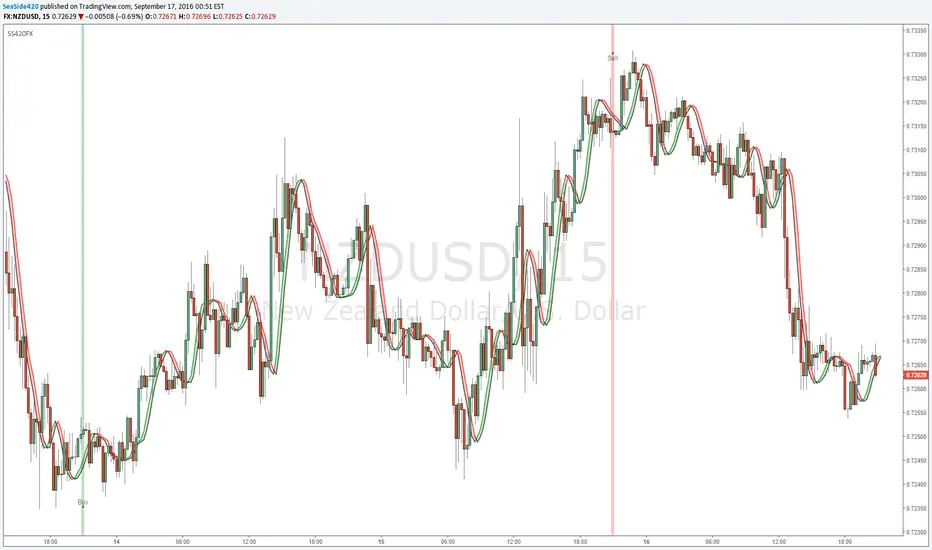
SS420FXTwo Moving_Average cross's & Daily_Candle cross
Based on Hull_MA
Developed by Alan Hull, it is an indicator, that solves the problem with making a moving average more reactive to current price activity. The Hull Moving Average almost eliminates lag and manages to improve smoothing.
The HMA manages to stick to rapid changes in price activity, as it has superior smoothing over a Simple Moving Average of the same period. The HMA employs Weighted Moving Averages (WMA) and dampens the smoothing effect. It can be calculated as follows:
HMA(n) = WMA(2*WMA(n/2) – WMA(n)), sqrt(n))
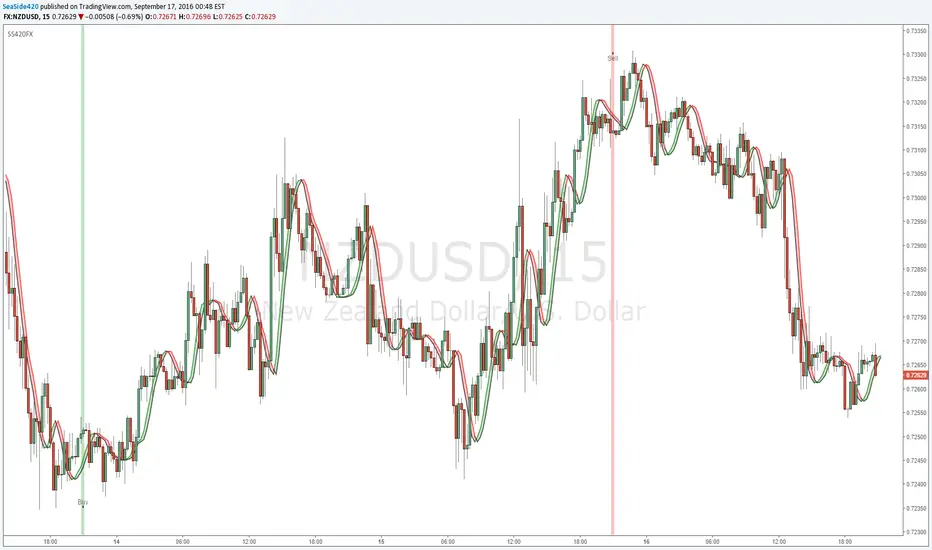
Doji signalsYou can create an alert based on this signal :)
Works on standard and Heikin-ashi candles
You can also adjust the sensitivity (how big you want the body of the doji)
:)

HEIKIN ASHI COLOUR CHANGE ALERTThis can be used to trigger an alert if Heikin Ashi bar changes color :)

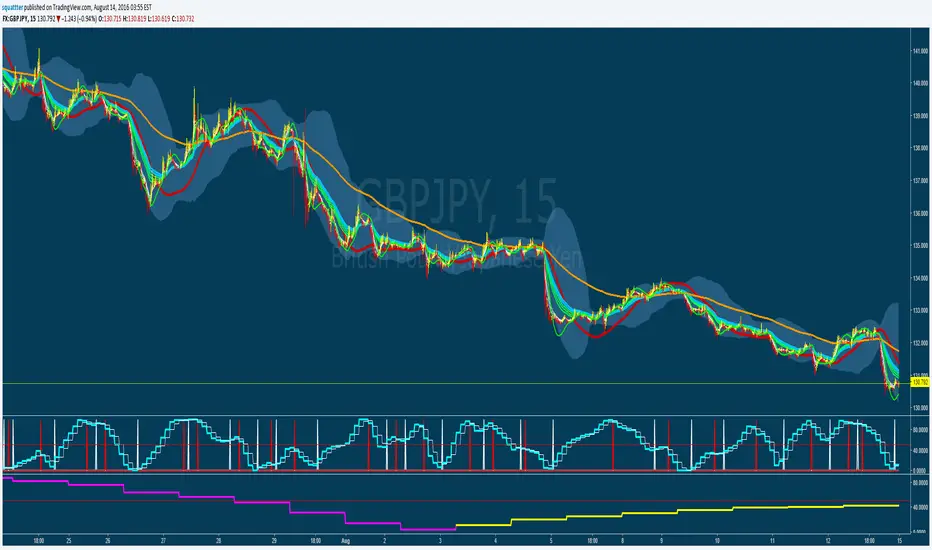
MTF Stochastic CCI ALERTWorks good on 5 or 15min set to the 2hr or 4hr time frame.
Set an alarm (Set an alert on each Long/Short "crossing down", 0.8 (or anything below 0.99), "on condition" )
Or just as a visual.
Best to use other factors to confirm but most of the time it does a pretty decent job.
Bollinger Band and ADX Retrace Alert v0.1 by JustUncleLThis script is an implementation of a well known Bollinger band + ADX retracement strategy for 1min to 15min charts. This variation uses my own settings, a market direction filter and has an alert that can be added to your trading alarms.