WaveRider [Scalping-Algo]# 📊 TrendPulse Pro - Indicator Guide
## 🎯 What is it?
A clean all-in-one trend tool. Combines 4 smoothed MAs, candlestick patterns & session highlights. No clutter, just signals.
---
## 🔧 Features
### 📈 4 Smoothed Moving Averages
- **21 SMMA** (Cyan) → Fast trend, scalping
- **50 SMMA** (Green) → Swing entries
- **100 SMMA** (Gold) → Medium trend filter
- **200 SMMA** (Red) → Major trend direction
💡 *Price above all = strong bull. Below all = strong bear.*
---
### ⚡ 3 Line Strike Pattern
Rare but powerful reversal signal.
- 🟢 **Bull 3LS** → 3 red candles + 1 big green that closes above first candle
- 🔴 **Bear 3LS** → 3 green candles + 1 big red that closes below first candle
💡 *Best near support/resistance zones.*
---
### 💎 Engulfing Candles
Shows momentum shift.
- 🟢 **Bull Engulf** → Green candle swallows previous red
- 🔴 **Bear Engulf** → Red candle swallows previous green
💡 *Filter with trend direction for better win rate.*
---
### 🕐 Session Highlight
See your trading window clearly.
- Light shade = Pre-session (prep time)
- Darker shade = Active session (go time)
💡 *Default is CME hours. Adjust in settings.*
---
## 📝 Quick Setup
1. Add to chart
2. Pick your timeframe (works on any)
3. Toggle what you need ON/OFF
4. Set your session times
5. Trade with confidence
---
## 🎨 Color Guide
| Element | Default Color | Meaning |
|---------|---------------|---------|
| 21 MA | Cyan | Fast trend |
| 50 MA | Green | Swing trend |
| 100 MA | Gold | Filter |
| 200 MA | Red | Big picture |
| Fill Green | Light Green | Bullish bias |
| Fill Red | Light Red | Bearish bias |
---
## ⚠️ Tips
✅ Use MA stack for trend bias
✅ Wait for patterns AT key levels
✅ Combine with volume
✅ Respect the 200 MA
❌ Don't trade against all MAs
❌ Don't chase every signal
❌ Don't ignore session times
---
## 🚀 Best Practices
**For Scalping:**
- Focus on 21 & 50 MA
- Trade engulfing patterns
- Use 1-5 min charts
**For Swing:**
- Focus on 100 & 200 MA
- Trade 3 Line Strike
- Use 1H-4H charts
---
Made with ☕ by a trader, for traders.
*"Keep it simple. Let price do the talking."*
Algo

Direction Bias [ Scalping-Algo ]======================================================================
// 📊 Direction Bias
// ======================================================================
//
// 🎯 What this indicator does:
// This indicator colors your candles based on the current market bias.
// 🟢 Green bars = bullish momentum
// 🔴 Red bars = bearish momentum
// ⚪ Gray bars = choppy or undecided market
//
// ⚙️ How it works:
// It uses a range filter that adapts to volatility. When price pushes
// above the filter and keeps moving up, you get green bars. When price
// drops below and continues down, you get red bars. The filter smooths
// out the noise so you don't get whipsawed on every little move.
//
// 📈 How to trade with it:
//
// 1️⃣ Follow the color
// 🟢 Green bars = look for longs only
// 🔴 Red bars = look for shorts only
// ⚪ Gray bars = stay out or reduce size
//
// 2️⃣ Entry timing
// ✅ Wait for color change from gray to green/red
// ✅ Enter on pullbacks while color stays the same
// ❌ Don't chase if you're late to the move
//
// 3️⃣ Exit signals
// 💡 When bars turn gray, tighten your stop or take profits
// 🔄 Color flip to opposite = close the trade
//
// 4️⃣ Best practices
// ⏱️ Works best on 1m to 15m charts for scalping
// 📍 Use with support/resistance levels for better entries
// 🚫 Don't trade against the color, even if you "feel" a reversal
// 📊 Combine with volume for confirmation
//
// 🔧 Settings:
// • Period: Higher = smoother but slower reaction (default 10)
// • Multiplier: Higher = less sensitive to small moves (default 4.0)
// • Adjust based on the asset you're trading
//
// 🔔 Alerts:
// Set alerts for "Bull" and "Bear" to get notified when bias changes.

EMA 200 Trend [Scalping-Algo]📊 EMA 200 TREND COLOR INDICATOR
// ════════════════════════════════════════════
//
// This indicator plots the 200 EMA with dynamic color changes based on the
// current market trend. Super simple, super clean!
//
// 🟢 GREEN = Bullish trend (price above EMA + EMA rising)
// 🔴 RED = Bearish trend (price below EMA + EMA falling)
// ⚪ GRAY = Neutral/consolidation
//
// ✨ FEATURES:
// • Clean visual representation of trend direction
// • Customizable colors to match your chart style
// • Optional background highlighting
// • Works on any timeframe
//
// 📈 HOW TO USE:
// • Look for price staying above green EMA for long entries
// • Look for price staying below red EMA for short entries
// • Gray color = wait for confirmation
//
// 💡 TIP: Works great with other indicators for confluence!
//
// If you found this useful, drop a like! 👍
// Happy trading! 🚀
════════════════════════════════════════════

Smart Reversal [Scalping-Algo]════════════════════════════════════════════
Smart Reversal
This indicator identifies potential reversal points using a two-step confirmation method that I developed for my own scalping. Unlike typical reversal indicators that rely on RSI oversold/overbought or simple candlestick patterns, this uses a different approach.
🔹 HOW IT WORKS
The logic is based on two phases:
Phase 1 - Anchor Detection:
The indicator looks for candles where price closes beyond ALL previous candles in the lookback period. For a bullish setup, the close must be below the lows of the last N candles (default 20). This isn't just a "lower low" - it's an extreme extension where price has broken below every single candle in the range. I also require this candle to have above-average volume (2x the 20-period average) to confirm real selling pressure, not just a gap or low-liquidity move.
Phase 2 - Confirmation:
After an anchor forms, I wait for price to reverse and close above the anchor candle's high (for buys) or below the anchor's low (for sells). This must happen within 3 bars. If price makes a new extreme instead, the setup cancels.
🔹 SIGNAL QUALITY SCORING
Each signal gets a score from 3/5 to 5/5:
- 3/5: Basic confirmation occurred
- 4/5: Anchor or confirmation had strong volume
- 5/5: Both volume conditions met + aligned with 200 EMA trend
I focus on 4/5 and 5/5 signals personally.
🔹 WHAT YOU SEE ON CHART
- Green/Red boxes: Active setup waiting for confirmation
- B or S labels: Confirmed signals with quality score
- Dashboard: Shows current status and volume condition
🔹 SETTINGS
- Bars to Check: How many candles for the breakout comparison (default 20)
- Confirmation Window: Bars allowed after anchor for confirmation (default 3)
- Volume thresholds: Adjustable multipliers for anchor (2x) and confirmation (1.2x)
🔹 SUGGESTED USE
- Works on any timeframe, but I use it mainly on 5-15 min charts
- Better results when combined with key support/resistance levels
- Avoid trading during high-impact news
════════════════════════════════════════════
════════════════════════════════════════════

Institutional Zone Detector [Scalping-Algo]█ OVERVIEW
The Institutional Zone Detector identifies key supply and demand zones where large market participants (institutions, banks, hedge funds) have likely placed significant orders. These zones often act as powerful support and resistance levels, making them strategic areas for trade entries and exits.
This indicator is non-repainting, meaning once a signal appears on your chart, it will never disappear or change position. What you see in backtesting is exactly what you would have seen in real-time.
█ CORE CONCEPT
Markets move when large players execute substantial orders. These orders leave footprints in the form of specific candlestick patterns:
Demand Zones (Bullish)
When institutions accumulate positions, we often see a bearish candle followed by a strong bullish sequence. The last bearish candle before this move marks the demand zone - an area where buying pressure overwhelmed sellers.
Supply Zones (Bearish)
When institutions distribute positions, we typically see a bullish candle followed by a strong bearish sequence. The last bullish candle before this move marks the supply zone - an area where selling pressure overwhelmed buyers.
Price has a tendency to revisit these zones, offering potential trade opportunities.
█ HOW IT WORKS
The indicator scans for:
1. A potential zone candle (bearish for demand, bullish for supply)
2. A sequence of consecutive candles in the opposite direction
3. Optional: A minimum percentage move to filter weak signals
When all conditions are met, the zone is marked on your chart with:
• Upper and lower boundaries (solid lines)
• Equilibrium/midpoint level (cross marker)
• Extended channel lines for easy visualization
█ SETTINGS
Consecutive Candles Required (Default: 5)
Number of same-direction candles needed after the zone candle to confirm the pattern. Higher values = fewer but stronger signals.
Minimum Move Threshold % (Default: 0.0)
Minimum percentage price movement required to validate a zone. Increase this to filter out weak moves and focus on significant institutional activity.
Display Full Candle Range (Default: Off)
• Off: Shows Open-to-Low for demand zones, Open-to-High for supply zones
• On: Shows complete High-to-Low range of the zone candle
Show Demand/Supply Zone Channel (Default: On)
Toggle extended horizontal lines that project the zone levels across your chart.
Visual Theme (Default: Dark)
Choose between Dark (white/blue) or Light (green/red) color schemes.
Show Statistics Panel (Default: Off)
Displays a floating panel with exact price levels of the most recent zones.
Display Info Tooltip (Default: Off)
Shows an information label with indicator documentation.
█ HOW TO USE
Entry Strategies
1. Zone Bounce (Mean Reversion)
• Wait for price to return to a previously identified zone
• Look for rejection candles (pin bars, engulfing patterns) at zone levels
• Enter in the direction of the original zone (long at demand, short at supply)
• Place stops beyond the zone boundary
2. Zone Break (Momentum)
• When price breaks through a zone with strong momentum
• The broken zone often becomes the opposite type (broken demand becomes supply)
• Use for trend continuation trades
3. Equilibrium Trades
• The midpoint (cross marker) often acts as a magnet for price
• Can be used as a first target or as an entry point for scaled positions
Risk Management
• Always place stop-loss orders beyond zone boundaries
• Consider the zone width when calculating position size
• Wider zones = wider stops = smaller position size
• Use the equilibrium level for partial profit taking
Best Practices
• Higher timeframes produce more reliable zones
• Zones on multiple timeframes (confluence) are stronger
• Fresh/untested zones are more powerful than zones that have been touched multiple times
• Combine with other analysis methods (trend direction, volume, market structure)
█ ALERTS
Two alert conditions are available:
• "Demand Zone Identified" - Triggers when a new demand zone is detected
• "Supply Zone Identified" - Triggers when a new supply zone is detected
To set up alerts: Click on the indicator name → Add Alert → Select condition
█ IMPORTANT NOTES
• This indicator is a tool for analysis, not a complete trading system
• Signals are NOT automatic buy/sell recommendations
• Always use proper risk management
• Past performance does not guarantee future results
• Works on all markets and timeframes
• Non-repainting: Signals appear only after bar close confirmation
█ ACKNOWLEDGMENTS
Inspired by institutional order flow concepts and smart money trading methodologies. Built with a focus on reliability and practical application.

Volume Anomaly Reversal DetectionVolume Anomaly Reversal Detection (VARD System)
🎯 What This Indicator Does
This indicator identifies potential trend reversals by detecting abnormal volume activity that often precedes significant price movements. It combines volume anomaly detection with dynamic trend analysis to generate actionable BUY/SELL signals.
📊 Core Concept & Methodology
Volume Anomaly Detection
The indicator analyzes directional volume (buying vs selling pressure) from a lower timeframe and calculates Z-scores to identify statistically significant volume spikes.
Z-Score Formula:
Z = (Current Volume - Average Volume) / Standard Deviation
When volume exceeds the threshold (default: 3 standard deviations above mean), it signals unusual market activity - often caused by forced liquidations or capitulation.
Dynamic Trend Filter
A custom trend-following algorithm based on ATR (Average True Range) bands determines the current market direction:
Price above lower band = Uptrend
Price below upper band = Downtrend
Signal Logic
Volume anomaly detected during an existing trend
Trend reversal confirmed within the confirmation window
Signal generated = BUY or SELL label appears
⚙️ Settings Explained
SettingDefaultDescriptionAnalysis Timeframe15minLower timeframe for volume samplingStatistical Lookback200Bars used for Z-score calculationAnomaly Sensitivity3.0Z-score threshold (lower = more signals)Confirmation Window50Max bars between anomaly and trend flipATR Multiplier2.0Trend band widthTrend Period10ATR calculation length
📖 How To Use
Entry Signals
BUY: Green label appears below bar - consider long positions
SELL: Red label appears above bar - consider short positions
Volume Anomaly Markers (⬥)
Small diamonds indicate detected volume spikes
These are early warnings before confirmed signals
Useful for anticipating potential reversals
Trend Bands
Colored zones show active signal direction
Stay with the trend until opposite signal appears
Best Practices
Confirm with price action - Look for support/resistance levels
Use appropriate timeframes - Works on all timeframes, but 1H-4H recommended
Manage risk - Always use stop losses
Avoid ranging markets - Best in trending/volatile conditions
⚠️ Important Notes
No indicator is perfect - Use as part of a complete trading strategy
Volume data required - Will show warning if volume unavailable
Not financial advice - Always do your own research
🔔 Alerts Available
BUY Signal Confirmed
SELL Signal Confirmed
Volume Anomaly (Buy Setup)
Volume Anomaly (Sell Setup)

LTF Distribution Analyzer█ OVERVIEW
LTF Distribution Analyzer reveals the hidden price distribution and order flow within each candle by sampling lower timeframe data. It visualizes where prices concentrated, how volume was distributed between buyers and sellers, and identifies divergences between price action and actual market participation.
Unlike traditional candlesticks showing only OHLC, this indicator exposes the statistical structure of price movement using quartile-based visualization combined with delta analysis.
█ CONCEPTS
The indicator is built on two core concepts:
1 — Statistical Price Distribution
Each candle contains many lower timeframe bars. By analyzing these bars, we calculate:
• Q1 (25th percentile) - 25% of prices traded below this level
• Q3 (75th percentile) - 75% of prices traded below this level
• Median - The middle price value
• IQR (Interquartile Range) - The Q3-Q1 spread containing 50% of all prices
2 — Volume Delta Analysis
Delta measures buying vs selling pressure:
• Delta = Buy Volume − Sell Volume
• Positive delta = More aggressive buying
• Negative delta = More aggressive selling
• Delta Ratio normalizes this as a percentage
█ HOW IT WORKS
The indicator fetches lower timeframe data using request.security_lower_tf() and processes it to create a statistical summary:
Step 1: Timeframe Calculation
• Auto mode: Chart timeframe ÷ Auto Divisor = LTF
• Example: 1H chart ÷ 1000 = ~3.6 second sampling
• Manual mode: User-specified timeframe
Step 2: Data Collection
• Collects all close prices from LTF bars within current candle
• Aggregates volume by candle direction (bullish/bearish)
Step 3: Statistical Analysis
• Calculates quartiles (Q1, Q3), median, and boundaries
• Identifies outliers using 1.5× and 3× IQR fences
• Finds Volume POC (price with highest volume)
Step 4: Delta Calculation
• Sums buy volume (from bullish LTF bars)
• Sums sell volume (from bearish LTF bars)
• Computes delta ratio for color determination
█ VISUAL ELEMENTS
┌─────────────────────────────────────────┐
│ ▲ Extreme outlier (3× IQR) │
│ △ Mild outlier (1.5× IQR) │
│ ─ Upper whisker cap │
│ ┊ Whisker line (dashed) │
│ ▄ IQR Box (Q1 to Q3 range) │
│ ━ Volume POC (highest volume) │
│ ● Median (green=bull, red=bear) │
│ ┊ Whisker line (dashed) │
│ ─ Lower whisker cap │
│ ▽ Mild outlier │
│ ▼ Extreme outlier │
└─────────────────────────────────────────┘
█ COLOR SYSTEM
Colors indicate the relationship between candle direction and order flow:
🟢 TEAL (Positive Flow)
Bullish candle + Positive delta
→ Strong buying confirmation
→ Trend continuation signal
🔴 RED (Negative Flow)
Bearish candle + Negative delta
→ Strong selling confirmation
→ Trend continuation signal
🟠 ORANGE (Mixed Signal A)
Bullish candle + Negative delta
→ Price up but sellers dominated
→ Potential weakness/reversal warning
🔵 BLUE (Mixed Signal B)
Bearish candle + Positive delta
→ Price down but buyers dominated
→ Potential accumulation/reversal signal
█ SETTINGS
Timeframe Settings
• LTF Mode — Auto or Manual selection
• Manual Timeframe — Specific LTF when in Manual mode
• Auto Divisor — Higher = finer granularity (default: 1000)
• Allow Sub-Minute — Requires Premium subscription
Visual Style
• Positive/Negative Flow colors — Customize the 4 flow colors
• Box Transparency — Opacity of the quartile box (0-100%)
Statistics Display
• Show Statistics Panel — Toggle on-chart stats table
• Show Timeframe Badge — Toggle LTF indicator badge
• Panel Position — Choose corner placement
• Panel Size — Text size selection
█ HOW TO USE
1. Divergence Detection
Look for color mismatches:
• Orange bars in uptrend = weakness, potential reversal
• Blue bars in downtrend = strength, potential reversal
• Multiple consecutive divergent bars strengthen signal
• Wait for confirmation before entry
2. Volume POC Trading
• POC marks where most volume traded
• POC clusters at similar levels = strong S/R zone
• Price often returns to POC before continuing
• Use POC for entry/exit targeting
3. Trend Confirmation
• Consecutive teal = strong uptrend
• Consecutive red = strong downtrend
• Median position shows intrabar momentum
• Wide boxes indicate high volatility
4. Outlier Analysis
• Extreme markers (▲▼) often mark stop hunts
• Consider fading extremes at key levels
• Mild markers (△▽) = areas to watch
█ RECOMMENDED SETTINGS
For different chart timeframes:
│ Chart TF │ Auto Divisor │ Resulting LTF │
├──────────┼──────────────┼───────────────┤
│ 15M │ 1500 │ ~1M │
│ 1H │ 1000 │ ~3-4s │
│ 4H │ 600 │ ~24s │
│ Daily │ 500 │ ~2-3M │
Tip: Check the TF badge to confirm active sampling timeframe.
█ BEST PRACTICES
Do:
✓ Use "Bars" chart style for cleanest display
✓ Combine with support/resistance analysis
✓ Wait for confirmation bars
✓ Note POC clusters across multiple bars
✓ Adjust divisor based on your timeframe
Avoid:
✗ Trading single bar signals alone
✗ Using during low volume periods
✗ Trading immediately after news releases
✗ Ignoring overall market context
█ LIMITATIONS
• Requires adequate market liquidity for reliable signals
• Sub-minute timeframes need Premium subscription
• Historical data depth depends on TradingView's data availability
• Delta calculation assumes volume direction matches candle direction
█ NOTES
This indicator works best on liquid markets (forex majors, major indices, popular stocks/crypto) where volume data is meaningful.
The gray dotted vertical line marks where LTF data becomes available - bars before this line won't display the indicator.
For questions or suggestions, leave a comment below.

Dynamic Support Resistance Zones======================================================================
TRADINGVIEW PUBLICATION - DYNAMIC SUPPORT RESISTANCE ZONES
======================================================================
TITLE: Dynamic Support Resistance Zones
SHORT TITLE: SR Zones
--------------------------------------------------------------------------------
DESCRIPTION (Copy below for TradingView publication)
--------------------------------------------------------------------------------
The Dynamic Support Resistance Zones indicator identifies key price levels where potential reversals may occur by analyzing candlestick behavior and volume dynamics together.
▶ CONCEPT AND METHODOLOGY
This indicator detects support and resistance levels through a specific combination of three market conditions occurring simultaneously:
1. Candlestick Body Expansion: The current candle's body (distance between open and close) must be larger than the previous candle's body. This signals increased price commitment from market participants.
2. Direction Reversal: The current candle must close in the opposite direction of the previous candle. A bullish candle following a bearish candle suggests potential support formation, while a bearish candle following a bullish candle suggests potential resistance formation.
3. Volume Contraction: The current candle must have lower volume than the previous candle. This condition filters out high-volume breakout moves and focuses on exhaustion patterns where price reverses on decreasing participation.
When all three conditions align, the indicator marks the opening price of the previous candle as a significant level.
▶ HOW LEVELS ARE CLASSIFIED
Support Zones (Green Lines): Form when a bullish reversal candle appears with an expanded body on declining volume. These represent areas where buying pressure overcame selling pressure.
Resistance Zones (Red Lines): Form when a bearish reversal candle appears with an expanded body on declining volume. These represent areas where selling pressure overcame buying pressure.
▶ DYNAMIC LEVEL MANAGEMENT
The indicator continuously monitors each level and updates its status:
- Active Levels (Solid Lines): Levels that have not been broken by a closing price. These extend forward automatically as new bars form.
- Broken Levels (Dashed Lines): When price closes beyond a level, it converts to a dashed line. These broken levels remain visible for potential retest scenarios.
- Level Removal: Broken support levels are removed if price closes back above them. Broken resistance levels are removed if price closes back below them. This keeps the chart clean and focused on relevant levels.
▶ TRADING APPLICATIONS
Reversal Trading: Look for price approaching active support or resistance levels for potential bounce trades.
Breakout Confirmation: When a solid level converts to dashed, it confirms a breakout. The dashed level then becomes a potential retest zone.
Trend Analysis: Multiple support levels stacking below price suggests bullish structure. Multiple resistance levels above price suggests bearish structure.
Risk Management: Active levels provide logical areas for stop-loss placement just beyond the identified zones.
▶ WHY THIS COMBINATION WORKS
The three-filter approach (body expansion + direction change + volume decline) identifies exhaustion reversals rather than continuation patterns. Large body candles show conviction, direction change shows momentum shift, and lower volume suggests the prior move is losing steam rather than breaking out with strength.
▶ SETTINGS
This indicator uses fixed detection logic with no adjustable parameters to maintain consistency. The colors are preset: green for support zones and red for resistance zones.
▶ BEST PRACTICES
- Works on all timeframes but higher timeframes typically produce more reliable levels
- Combine with trend analysis for directional bias
- Not all levels will hold; use proper risk management
- More effective in ranging or mean-reverting conditions than strong trending markets
--------------------------------------------------------------------------------
TAGS (for TradingView)
--------------------------------------------------------------------------------
support, resistance, reversal, volume, candlestick, levels, zones, price-action
--------------------------------------------------------------------------------
CATEGORY
--------------------------------------------------------------------------------
Support and Resistance
======================================================================

Triple EMA + Key Levels [Scalping-Algo]TITLE: Triple EMA Day Trading System with Multi-Timeframe Support/Resistance Levels
DESCRIPTION:
📊 Overview
This indicator combines trend-following EMAs with key historical price levels to create a complete day trading toolkit. It helps traders identify trend direction while highlighting important support and resistance zones from multiple timeframes.
🎯 Purpose & Trading Application
Day traders often need to quickly assess:
1. Current trend direction (using EMAs)
2. Key price levels where reversals or breakouts may occur
This indicator solves both needs in one tool, reducing chart clutter from multiple indicators.
📈 How It Works
TREND IDENTIFICATION (EMAs):
- EMA 13 (Yellow): Fast EMA for short-term momentum and entry timing
- EMA 48 (Purple): Medium EMA for intraday trend direction
- EMA 200 (Red): Slow EMA for overall trend bias
Trading Logic:
- When price is above all 3 EMAs = Strong bullish bias
- When price is below all 3 EMAs = Strong bearish bias
- EMA crossovers signal potential trend changes
- The 13/48 crossover is particularly useful for intraday entries
SUPPORT & RESISTANCE LEVELS:
- Previous Day High/Low (Green, Solid): Most recent daily range - high probability reaction zones
- 2-Day High/Low (Blue, Dashed): Extended lookback for stronger levels
- Previous Week High/Low (Orange, Dotted): Major institutional levels
Why These Levels Matter:
Previous day and weekly highs/lows are watched by many traders and algorithms. Price often:
- Reverses at these levels (support/resistance)
- Accelerates through them (breakout trades)
🔧 How To Use
FOR TREND TRADING:
1. Identify bias using EMA stack (all 3 aligned = strong trend)
2. Look for pullbacks to EMA 13 or 48 for entries
3. Use key levels as profit targets
FOR REVERSAL TRADING:
1. Watch for price approaching previous day/week levels
2. Look for rejection candles at these levels
3. Use EMA 13 break as confirmation
FOR BREAKOUT TRADING:
1. Identify consolidation near key levels
2. Enter on break of level with volume
3. Use opposite level as target
⚙️ Settings
All parameters are fixed for simplicity:
- EMAs: 13, 48, 200 periods
- Levels: Previous Day, 2-Day, Previous Week
- All lines thickness: 2
📝 Notes
- Best used on intraday timeframes (1min to 1hour)
- Levels update automatically each day/week
- Labels on right side identify each level (PDH, PDL, 2DH, 2DL, PWH, PWL)
---
TAGS: ema, daytrading, support, resistance, levels, intraday, trend, scalping, swingtrading

EMA + RSI Autotrade Webhook - VarunOverview
The EMA + RSI Autotrade Webhook is a powerful trend-following indicator designed for automated crypto futures trading. This indicator combines the reliability of Exponential Moving Average (EMA) crossovers with RSI momentum filtering to generate high-probability buy and sell signals optimized for webhook integration with crypto exchanges like Delta Exchange, Binance Futures, and Bybit.Key Features
Simple & Effective: Uses proven EMA 9/21 crossover strategy
RSI Momentum Filter: Eliminates low-probability trades in ranging markets
Webhook Ready: Two clean alerts (LONG Entry, SHORT Entry) for seamless automation
Exchange Compatible: Works with Delta Exchange, 3Commas, Alertatron, and other webhook platforms
Zero Lag Signals: Real-time alerts on crossover confirmation
Visual Clarity: Clean chart markers for easy signal identification
How It Works
Entry Signals:
LONG Entry: Triggers when EMA 9 crosses above EMA 21 AND RSI is above 52 (bullish momentum confirmed)
SHORT Entry: Triggers when EMA 9 crosses under EMA 21 AND RSI is below 48 (bearish momentum confirmed)
Technical Components:
Fast EMA: 9-period (tracks short-term price action)
Slow EMA: 21-period (identifies primary trend)
RSI: 14-period (confirms momentum strength)
RSI Long Threshold: 52 (filters weak bullish signals)
RSI Short Threshold: 48 (filters weak bearish signals)
Best Use Cases
Crypto Futures Trading: Bitcoin, Ethereum, Altcoin perpetual contracts
Automated Trading Bots: Integration with Delta Exchange webhooks, TradingView alerts
Timeframes: Optimized for 15-minute charts (works on 5min-1H)
Markets: Trending crypto markets with clear directional moves
Risk Management: Best used with 1-2% stop loss per trade (managed externally)
Webhook Automation Setup
Add indicator to your TradingView chart
Create alerts for "LONG Entry" and "SHORT Entry"
Configure webhook URL from your exchange (Delta Exchange, Binance, etc.)
Use alert message: Entry LONG {{ticker}} @ {{close}} or Entry SHORT {{ticker}} @ {{close}}
Exchange automatically reverses positions on opposite signals
Advantages
✅ No manual trading required - fully automated
✅ Eliminates emotional trading decisions
✅ Catches trending moves early with EMA crossovers
✅ RSI filter reduces whipsaws in choppy markets
✅ Works 24/7 without monitoring
✅ Simple two-alert system (easy to manage)
✅ Compatible with multiple exchanges via webhooksStrategy Philosophy
This indicator follows a trend-following with momentum confirmation approach. By waiting for both EMA crossover AND RSI confirmation, it ensures you're entering trades with genuine momentum behind them, not just random price noise. The tight RSI thresholds (52/48) keep you aligned with the prevailing trend.Recommended Settings
Timeframe: 15-minute (primary), 5-minute (scalping), 1-hour (swing)
Markets: BTC/USDT, ETH/USDT, high-liquidity altcoin perpetuals
Position Sizing: 100% capital per signal (exchange manages reversals)
Stop Loss: 2% (managed via exchange or external bot)
Leverage: 1-2x for conservative approach, up to 5x for aggressive
Important Notes
⚠️ This indicator generates entry signals only - position reversals are handled automatically by your exchange
⚠️ Always backtest on historical data before live trading
⚠️ Use proper risk management and position sizing
⚠️ Best performance in trending markets; may generate false signals in tight ranges
⚠️ Requires TradingView Premium or higher for webhook functionalityTags
cryptocurrency futures automated-trading ema-crossover rsi webhook delta-exchange tradingview-alerts trend-following momentum bitcoin ethereum crypto-bot algo-trading 15-minute-strategy

Apex Edge – Liquidity RaiderApex Edge – Liquidity Raider
The Predator That Hunts Where Retail Never Looks
The Liquidity Raider is not your average liquidity line plotter.
This is an institutional-grade hunting system that tracks the pools of liquidity Smart Money algos stalk — and tells you exactly when price is circling in for the strike.
Where most retail tools simply mark lines, this one acts like a predator:
Scans the chart dynamically to detect clustered highs & lows (pivot-based liquidity zones).
Filters noise with sensitivity & price rounding so you only get real liquidity levels — not every random swing.
Plots live BSL (Buy-Side Liquidity) & SSL (Sell-Side Liquidity) lines in clean dotted format.
Auto-deletes levels when swept, so your chart stays clean and focused.
Triggers directional arrows when price comes within your specified % distance to the target liquidity pool — before the market moves.
EMA confluence layer lets you align with institutional flow (customizable Fast & Slow EMAs).
Core Power
Cluster Logic – Finds high-probability liquidity zones using repeated pivot levels.
Sweep Awareness – Lines vanish the moment liquidity is taken, keeping focus on the next pool.
Proximity Strike Detection – Arrow signals only when price is within striking range.
Directional Clarity – Red arrows = targeting BSL, Green arrows = targeting SSL.
Scalable Across Timeframes – Adapts to your chart’s timeframe with dynamic lookback scaling.
Institutional Flow Filter – Optional EMA confirmation keeps you aligned with the real trend.
How to Use
Identify liquidity pools – Dotted green = buy-side, dotted red = sell-side.
Watch proximity arrows – These mean price is in range and hunting that pool.
Align with EMA bias – Enter only in the direction of institutional momentum.
Target the sweep – Your take profit is where the liquidity is resting.
Why Liquidity Raider Wins
This is not a lagging signal system.
It’s a real-time, clean, predictive tool designed to mimic the targeting logic of high-frequency algos.
By removing swept levels and focusing only on the next available pools, Liquidity Raider keeps you one step ahead of the crowd — and perfectly positioned for the kill shot.

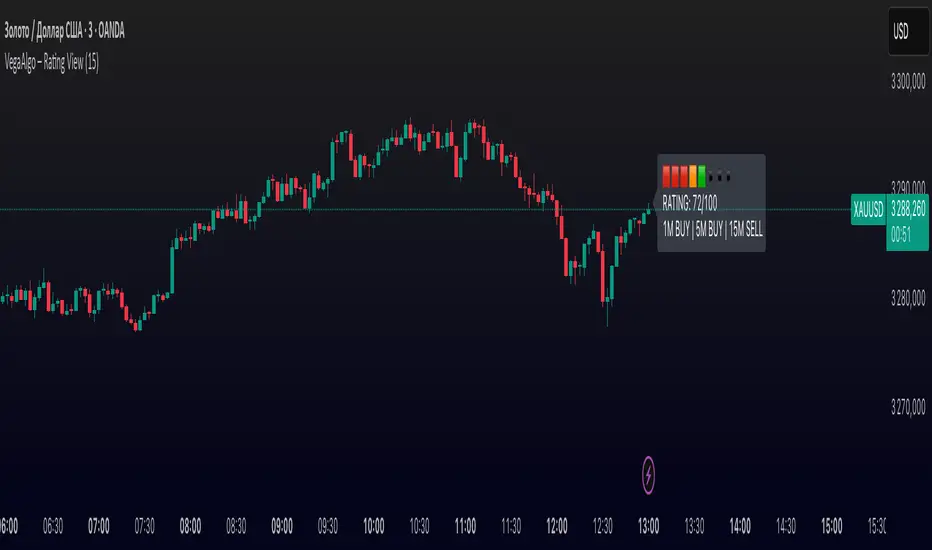
VegaAlgo – Rating ViewVegaAlgo – Rating View is a market condition analysis tool designed to evaluate the current price structure.
The indicator calculates a RATING (from 0 to 100) that reflects how clean, directional, and structured the recent price movement is. The rating is based on the number of price direction changes (from bullish to bearish candles and vice versa) within a selected period. Fewer direction changes indicate a clearer trend and result in a higher rating, while a choppy or highly volatile market leads to a lower score.
Additionally, the indicator provides directional signals on three key timeframes — 1M, 5M, and 15M, using a comparison of fast and slow moving averages. This allows traders to quickly assess the dominant trend both locally and across higher timeframes.
This script is intended for visual market analysis only and should not be considered financial advice.
Flow Optimized Moving AverageOverview
The Flow Optimized Moving Average (Flow OMA) is an advanced adaptive moving average designed to dynamically adjust smoothing factors based on market efficiency and volatility. By integrating the Efficiency Ratio (ER) with an Adaptive Moving Average (AMA) and leveraging ATR-based bands, this indicator provides traders with a refined tool for identifying trend direction, strength, and potential reversal zones.
Key Features
Adaptive Moving Average (AMA)
Adjusts to price action based on the Efficiency Ratio (ER), reducing lag in trending markets while smoothing noise in ranging conditions.
Efficiency Ratio (ER)
Measures the effectiveness of price movement over a defined lookback period.
Helps in dynamically adjusting the smoothing constant of the AMA.
ATR-Based Volatility Bands
Creates upper and lower dynamic bands based on the Average True Range (ATR).
Expands in high volatility and contracts in low volatility, providing traders with a contextual understanding of price action.
Slope-Based Trend Strength
Normalizes the moving average slope relative to ATR.
Generates a trend strength score, which influences band opacity, making strong trends visually distinguishable.
Dynamic Color Coding
Bullish Trends: Cyan/Turquoise (#00e2ff)
Bearish Trends: Blue (#003ff5)
Neutral Trends: Gray
The transparency of the bands dynamically adjusts based on trend strength.
Fill Zone Effect
The area between the ATR bands is filled with a gradient-like effect, giving a clear visual representation of trend strength and transitions.
Indicator Components
Inputs (User Settings)
ER Lookback Period: Defines how many bars are used in the Efficiency Ratio calculation (default: 10).
Fast & Slow Periods: Control the sensitivity of the Adaptive Moving Average (default: 2 & 30).
ATR Period: Defines the lookback for Average True Range (default: 14).
Band Multiplier: Determines the width of ATR-based bands (default: 1.5).
Slope Average Period: Smooths trend slope for more stable trend assessment (default: 5).
Efficiency Ratio Calculation
Measures how effectively price moves in a straight line compared to its total movement.
A higher ER value suggests strong trend momentum, while a lower value implies consolidation.
Adaptive Moving Average (AMA)
Dynamically adjusts its smoothing factor based on ER.
Uses a smoothing constant that ranges between the fastest and slowest specified values.
Volatility-Based Bands
Constructed using the ATR multiplier.
Expand and contract dynamically in response to market volatility.
Trend Strength & Direction
Computed using the normalized slope of AMA against ATR.
Positive slope = Bullish trend, Negative slope = Bearish trend.
Visual Enhancements
Colored Adaptive MA Line: Changes based on trend direction.
ATR Bands with Gradient Fill: Visual representation of market conditions.
Dynamic Opacity: Highlights trend strength through transparency.
How to Use the Flow OMA Indicator
Trend Identification
When the Adaptive MA is rising and colored cyan, a bullish trend is in play.
When the Adaptive MA is falling and colored blue, a bearish trend is present.
Trend Strength Assessment
A stronger trend results in more opaque band fills, indicating a clear directional bias.
Weaker trends or consolidations result in fainter fills, signaling a loss of momentum.
Reversal Signals
If price touches the upper band in a bullish move and starts reversing, it can indicate potential profit-taking areas.
If price approaches the lower band in a bearish move and rebounds, a short-term reversal may be imminent.
Volatility Insights
Narrow bands indicate low volatility and possible breakout conditions.
Wider bands suggest increased volatility, warning traders of potential price swings.
Best Practices
✅ Combine with Other Indicators
Use RSI, MACD, or Volume Profile for confirmation before executing trades.
✅ Apply to Multiple Timeframes
Works effectively in higher timeframes (1H, 4H, Daily) for trend trading.
Can be utilized in lower timeframes (5m, 15m) for scalping setups.
✅ Adjust Parameters Based on Asset Volatility
Increase ATR Period for stocks with high volatility.
Reduce ATR Multiplier for forex pairs to avoid excessive band width.
The Flow Optimized Moving Average (Flow OMA) is a powerful trend-following tool designed for both swing and intraday traders. Its adaptive nature allows it to efficiently track trends while minimizing false signals. By incorporating dynamic volatility bands and trend-sensitive color coding, this indicator enhances traders' ability to read price action effectively. Whether used standalone or in combination with other indicators, Flow OMA provides a significant edge in trend analysis.

Volume Flow Indicator Signals | iSolani
Volume Flow Indicator Signals | iSolani: Decoding Trend Momentum with Volume Precision
In markets where trends are fueled by institutional participation, discerning genuine momentum from false moves is critical. The Volume Flow Indicator Signals | iSolani cuts through this noise by synthesizing price action with volume dynamics, generating high-confidence signals when capital flows align with directional bias. This tool reimagines traditional volume analysis by incorporating volatility-adjusted thresholds and dual-layer smoothing, offering traders a laser-focused approach to trend identification.
Core Methodology
The indicator employs a multi-stage calculation to quantify volume-driven momentum:
Volatility-Adjusted Filter: Measures price changes via log returns, scaling significance using a 30-bar standard deviation multiplied by user-defined sensitivity (default: 2x).
Volume Normalization: Caps extreme volume spikes at 3x the 50-bar moving average, preventing distortion from anomalous trades.
Directional Volume Flow: Assigns positive/negative values to volume based on whether price movement exceeds volatility-derived thresholds.
Dual Smoothing: Applies consecutive SMA (3-bar) and EMA (14-bar) to create the Volume Flow Indicator (VFI) and its signal line, filtering out transient fluctuations.
Breaking New Ground
This implementation introduces three key innovations:
Adaptive Noise Gates: Unlike static volume oscillators, the sensitivity coefficient dynamically adjusts to market volatility, reducing false signals during choppy conditions.
Institutional Volume Capping: The vcoef parameter limits the influence of outlier volume spikes, focusing on sustained institutional activity rather than one-off trades.
Non-Repainting Signals: Generates single-per-trend labels (buy below bars, sell above) to avoid chart clutter while maintaining visual clarity.
Engine Under the Hood
The script executes through five systematic stages:
Data Preparation: Computes HLC3 typical price and its logarithmic rate of change.
Threshold Calculation: Derives dynamic cutoff levels using 30-period volatility scaled by user sensitivity.
Volume Processing: Filters raw volume through a 50-bar SMA, capping extremes at 3x average.
VFI Construction: Sums directional volume flow over 50 bars, smoothed with a 3-bar SMA.
Signal Generation: Triggers alerts when VFI crosses zero, confirmed by a 14-bar EMA crossover.
Standard Configuration
Optimized defaults balance responsiveness and reliability:
Volume MA: 50-bar smoothing window
Sensitivity: 2.0 (doubles volatility threshold)
Signal Smoothing: 14-bar EMA
Volume Cap: 3x average (hidden parameter)
VFI Smoothing: Enabled (3-bar SMA)
By fusing adaptive volume filtering with price confirmation logic, the Volume Flow Indicator Signals | iSolani transforms raw market data into institutional-grade trend signals. Its ability to mute choppy price action while amplifying high-conviction volume moves makes it particularly effective for spotting early trend reversals in equities, forex, and futures markets.

Algo Market Structure (Nephew_Sam_)This indicator takes a different approach into reading market structure.
The key difference between this logic compared to the pivot logic is; we read highs and lows based on bullish and bearish candles. Ie:
Pivot method - highest/lowest point in previous and next X candles
Algo method - Bullish candle(s) followed by a bearish candle and vice versa
More explanation in each of the key feature below.
Here are all of the concepts and features included in the indicator:
Timeframe
- You can select the timeframe of the indicator (has to be higher or equal to the chart timeframe)
- Min option is the minimum timeframe to show the indicator. If you show daily structure on 1m chart, you can run into a timeout error so keep it close to the chart timeframe.
- Recommended timeframe for no bugs is the current chart timeframe.
Structure
The structure is calculated using a combination of candle patterns (ie. pivot top = Bullish x3-Bearish-Bullish) and marks out circle labels after a new HH or LL
Structure high = 1 or more consecutive bull candles followed by a bear candle
Structure low = 1 or more consecutive bear candles followed by a bull candle
Structure direction change = when the second previous H/L is taken out (TLQ)
ILQ - Inducement Liquidity concept
In a bearish example this is the most recent structure high.
TLQ
In a bearish example this is the second most recent structure high.
This is also what helps define our structure direction. If broken, the structure changes (bullish / bearish) and plots a bos line.
EPA - Efficient price action
When price returns back to previous structure point after bos. Similar to an ICT breaker.
Note: It might be a little, just a little buggy if you have set your indicator timeframe to higher than the chart timeframe.
Extremes Zones
The final zone to find a trade entry before a structural shift. These are wick of the TLQ candle. This is select the wick of the current timeframe candle even if indicator is set to higher timeframe.
MSU
Tiny arrow labels at the bottom of your chart. Plots the arrows when price is between an ILQ and TLQ
VTA
Valid trading range. This is when we get some sort of a structure pattern. Plots a box when price induces previous structure point and then breaks structure in the opposite direction. Here are the patterns:
Bull VTA - HH-LL-HH
Bear VTA - LL-HH-LL
Bull Strict VTA - LL-HH-LL-HH
Bear Strict VTA - HH-LL-HH-LL
Bar colors
Changes the bar color based on the structure to all green/red.
Note: for this to work, you will have to right click on the indicator, then under visual order select 'bring to front'
Table
This table plots the structure stats/data
1. If structure is bullish / bearish
2. If price is efficient or not
3. If there is an MSU
4. If price is inside a VTA
Disclaimer: This indicator is fully written from scratch by me, the idea behind the concepts come from AlgoHub material on Youtube. Do NOT use this code for reselling purposes and if anything is created using any part of this code, the source code should be public.

ICT Kill Zones [dR-Algo]ICT Kill Zones Indicator by dR-Algo
Introducing the dR-Algo's ICT Kill Zones Indicator – a tool meticulously crafted to blend with the elegance of the ICT Concept of Kill Zones. Built for traders who seek clarity and focus, this unique indicator is tailored to highlight the essential time frames while ensuring minimal distraction from the core price action.
Key Features:
Three Kill Zones:
London Kill Zone: Kickstart your trading day with the London Kill Zone, highlighting the critical period between 03:00 to 04:00 (UTC-4). The London session, known for its volatility due to the overlapping of the Asian session, is captured precisely for your benefit.
NY AM Session: As the European markets gear towards close and the US markets come alive, our indicator emphasizes the activity from 10:00 to 11:00 (UTC-4). It’s a window where significant market moves often originate.
NY PM Session: Capture the late-day trading action between 14:00 to 15:00 (UTC-4). As markets prepare to close, this time frame can offer last-minute opportunities.
Subtle Yet Effective Visualization: Unlike many other indicators that bombard traders with an array of colors, our ICT Kill Zones Indicator is intentionally designed to be subtle. It provides just the right amount of visual emphasis without overwhelming the chart. The primary goal is to let traders focus on what truly matters: the price action.
User-Friendly Customization: The indicator's settings can be easily tailored to align with individual trading styles, allowing traders to adjust and tweak as per their preference.
Seamless Integration with Trading View: Smoothly integrates with your TradingView charts ensuring optimal performance and real-time responsiveness.
Why Choose Our ICT Kill Zones Indicator?
The market is flooded with indicators, each promising to be the 'next big thing.' What sets dR-Algo's ICT Kill Zones Indicator apart is its dedication to simplicity and effectiveness. It's not just about adding an indicator to your chart; it's about adding value to your trading experience. By seamlessly merging vital time frames without overshadowing the price action, we ensure traders get the best of both worlds.
Join the trading revolution with dR-Algo and embrace a focused approach to the markets.

30 Second Futures Session Open RangeThis indicator displays 30 second opening ranges from Globex, Europe, and RTH sessions.
From the RTH session range, it also displays infinitely generating Price Targets based on a % of the opening range size.
I am retrieving the 30 second data using the new "request.security_lower_tf()" function.
The importance of these levels is based on the idea that when the market opens, algorithms establish their positions within the first 30 seconds.
These areas can also be seen as potential areas of support and resistance throughout the sessions.
Enjoy!

RSI Algo (Pinescript v5 + Alerts)Found this the other day and thought it might be useful to have an updated version with alerts:
Credit to the original author.
Percentile Rank Market FilterA simple script to filter bull and bear markets by using percentile rank filter. Using market regimes to filter by bull/bear/sideways markets helps to understand how your strategy will
behave in various market regimes and allows you to avoid unprofitable regimes and only trade in profitable ones.
The idea of market regime filtering is used in the most successful technical algorithmic trading strategies, as one should always design a trading strategy with a particular market in mind according to trading legend, Larry Connors
Feel free to use this script in your strategies to improve your profits and lower drawdowns.
