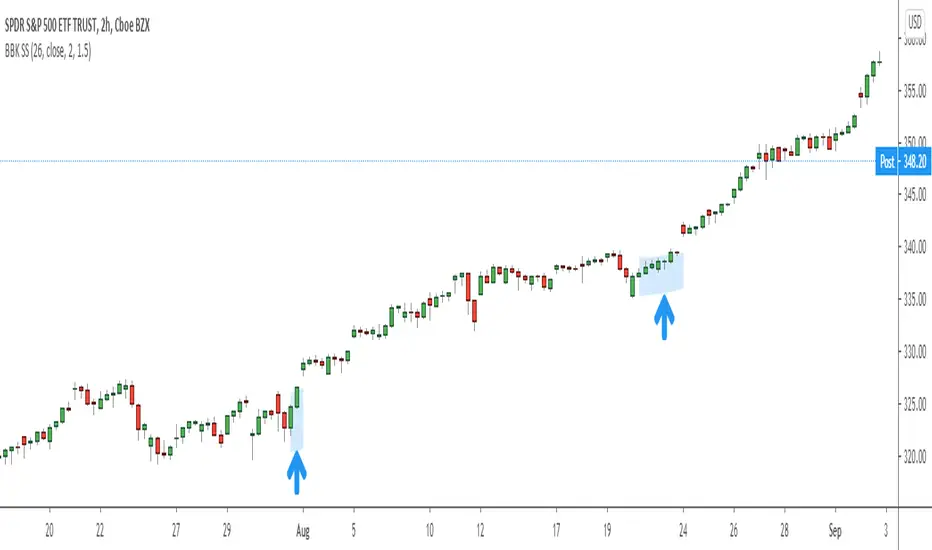
BB Keltner Squeeze Signal 1.0Made this to signal when the criteria is met for a "Bollinger Band + Keltner Channel Squeeze" signal. This is when one or both of the Bollinger Bands come inside the Keltner Channel. When this happens the bars are highlighted. The idea of this script is to clean up charts as much as possible.
Bollinger Bands are measures of standard deviation from a simple moving average. This is the distance that price travels as a whole over time. Keltner Channels are a measure of ATR from an exponential moving average. This is the average range of individual bars.
Both indicators measure volatility and when they contract indicate that price is consolidation. A very tight consolidation can often be a prelude to an expansion of volatility and price movement. It can be a signal for a potential breakout or confirmation one will be successful.
The actual Bollinger Bands and Keltner Channels are turned off by default but can be turned on in the script settings. I also use 26 as the default length but it can be changed.
Средний истинный диапазон (ATR)
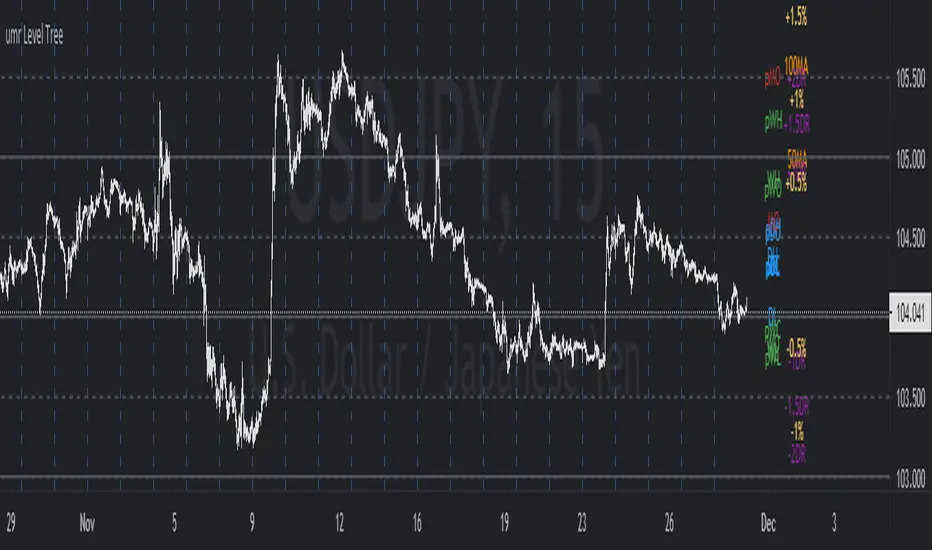
umr Level TreeShows following levels and labels (which can be individually controlled):
OHLC levels of Today, Yesterday, This week, Last week, This Month, Last Month
Daily Simple Moving Averages (50, 100, 200)
Horizontal Grid on 50, 100 pips for FX instruments.
(to do) Add ATR or Std Deviation
(to do) Add Daily Change levels % i.e. 0.5%, 1%, 2%
(to do) Add Daily change in pips levels (for fx) i.e. 50 pips, 100 pips etc
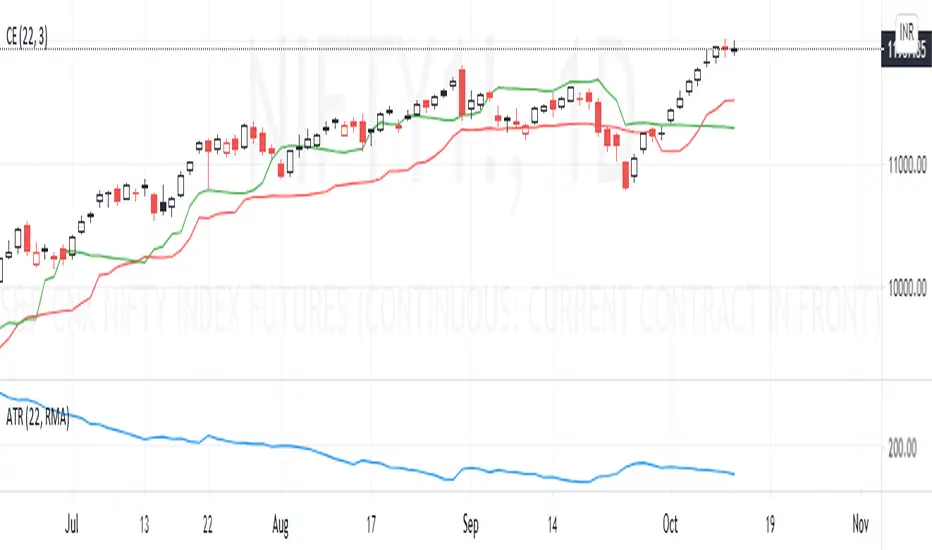
Chandelier ExitChandelier Exit (CE) is a volatility-based indicator developed by "Chuck Le Beau", ATR is used to measure the Volatility.
It identifies stop loss exit points for long and short trading positions.
Configuring the ATR period = 1 and Multiplier = (say) 1.25 or 1.5, it can be used for readily available buffer Stop Loss value from previous high/low.
Relative ATRThis script was originally for finding the ATR for Range Bars, by subtracting (close - open) and then taking the moving average.
It has been updated to allow the user to select which sources to subtract, and set the period for the moving average.
In this script, bars shown above zero indicate that price is increasing and bars shown below zero indicate that price is decreasing.
Look for divergences in the output plot. Plotting as columns or area work best for seeing divergence, IMO.
It can also be used to monitor ATR on a higher time frame by changing the resolution.
WARNING: I am not a licensed financial advisor. This script is intended for entertainment purposes only. It is available publicly, free of charge. Use at your own discretion and risk. Never blindly follow any indicator or strategy, always follow your own Trading Rules.
If you like this script, please give it a Thumbs Up and leave a comment. Requests for custom scripts and strategies are welcome.

Daily Average True RangeIf you want to get an idea if the current range (low to high) is extended or not?
This script should help you to get an idea relative to the ATR.
Further comments you find in the script.
Feel free to modify upon your needs.
Jonas
NB: Due to issues around the "security" function, the recommended patch of Trading View was implemented.

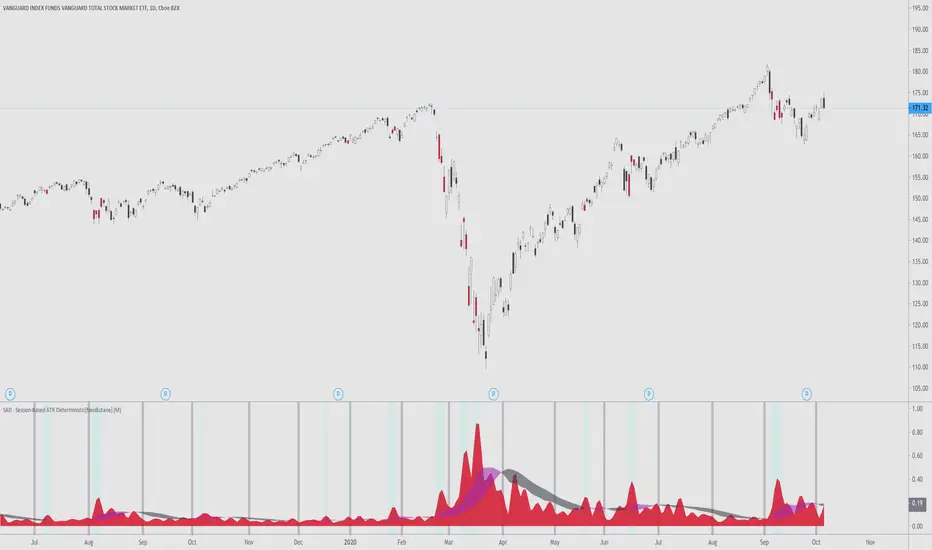
SAD - Session-Based ATR Deterministic[NeoButane]SAD - ATR with a utility tune-up.
Similar to ATR, SAD finds the true range of an asset. Unlike ATR, which is a rolling indicator, SAD is session based, simliar to VWAP. This gives it a great advantage over a regular ATR, where one must determine if their ATR level is statistically significant or not. SAD makes it easy for you to analyze statistical anomalies without having to pull out a calculator.
By breaking up ATR in sessions, it is able to be determined when price has moved an abnormal amount in a session deterministically. Noise is removed by a moving average filter, the weighted moving average. This was chosen over the EMA?SMA because an EMA would be to quick to change and the SMA would be too slow.
The ribbon's colors, purple, is active when volatility is rising. It is black when volatility is falling. You can see that this is directionally neutral.
Options to configure:
Timeframe
Ribbon dipslay
Session break display
[*}Bar coloring
Common examples of usage:
If you want to use this indicator, add it to your favorites and you can find it there.
Supertrend Screener PanelScript to display Supertrend trend state of 8 different securities in a panel. Timeframe & Tickers which are to be displayed can be configured from settings.
Part of code is from the ADX DI Monitoring Panel script by u/wugamlo with his permission. Thanks to him for that and do please check out his work also.

Volatility Bands by DGTVolatility represents how large an asset's prices swing around the mean price, the degree of variation of a trading price over time, and is commonly measured with beta (β) coefficients, standard deviations (σ) of returns where tools such as Average True Range, Bollinger Bands, Keltner Channel, Squeeze Indicator, etc presents volatility concept
Volatility often refers to the amount of uncertainty or risk related to the size of changes in a security's value. The higher the volatility, the riskier the security - the price of the security can change dramatically over a short time period in either direction. A lower volatility - security's value does not fluctuate dramatically, and tends to be more steady
This study, Volatility Bands , attempts to present a way to measure and visualize volatility , using standard deviations (σ) and average true range indicator, and aims to point out areas that might indicate potential trading opportunities
I will try to explain the usage with examples,
same setup with different option selected
as you may observe from the examples different setting may have advantages and disadvantages over one another, it is recommended to verify a trading setup with different available options.
Additionally, It is recommended to use this indicator in conjunction with other technical indicators, or verify using chart/candle patterns. Below is an usage example using in conjunction with other indicator, in the given example “Neglected Volume by DGT” is selected
Similarities and Differences
Bollinger Bands depicts two standard deviations above and below a simple moving average, and Keltner Channel depicts two times average true range (ATR) above and below an exponential moving average
Volatility Bands study combines the approach of both Bollinger Bands and Keltner Channel, with different settings and different visualization
Default settings are one standard deviations and one time average true range (ATR) above and below 13 period exponential moving average. Setting can be adjusted by users but let me remind all testes are performed with the default settings.
Mathematically expressed as
Upper band area between “ema + stdev” and “ema + atr”
Lower band area between “ema – stdev” and “ema – atr”
A different display is added with the inspiration I get from one of the @quantgym ‘s study, many thanks @quantgym 😉
When difference band display is selected the study will reflect the area between “ema + stdev – atr” and “ema – stdev + atr”. As shown in the examples above
Note: standard deviation calculation can be adjusted based on price action or its moving average.
Other differentiation between BB and KC is with V-BANDS mostly we look for trade opportunities when price action move out of the bands and in most cases we assume market is consolidating when the price action is within the bands
The other indicator that presents similarities to Volatility Bands is Squeeze Indicator, which measures the relationship between Bollinger Bands and Keltner's Channels to help identify consolidations and signal when prices are likely to break out. Mainly Volatility Bands is different version of Squeeze indicator, in fact the purpose is almost same but visualization is completely different. Additionally Volatility Bands Offers trading opportunities whereas Squeeze indicator only presents market states unless a momentum indicator is adapted to Squeeze indicator.
Disclaimer:
Trading success is all about following your trading strategy and the indicators should fit within your trading strategy, and not to be traded upon solely
The script is for informational and educational purposes only. Use of the script does not constitute professional and/or financial advice. You alone have the sole responsibility of evaluating the script output and risks associated with the use of the script. In exchange for using the script, you agree not to hold dgtrd TradingView user liable for any possible claim for damages arising from any decision you make based on use of the script

Popgun Bar PatternI created this script to research the trading effectiveness of the Popgun Bar Pattern.
The Popgun Bar Pattern is found when 3 candlesticks in order form the following pattern:
0. Any bar that is then followed by:
1. An inside bar. This is a bar that is completely engulfed by the bar before it. It will have a lower high and a higher low than the previous bar.
2. An outside bar immediately after. This is a bar that completely engulfs the prior inside bar. It will have a higher high and a lower low than the previous bar.
Simply put, the Popgun Bar Pattern is an inside bar followed by an outside bar.
I would highly recommend incorporating this signal as a "trigger" for existing technical analysis. Used in isolation it may not have a high probability of success.
To make it more effective as a trigger to a trading signal I incorporated into my code an Entry, Stop, and a Target dot.
The Entry dot is offset from the low of a bearish Popgun Bar Pattern or the high of a bullish Popgun Bar Pattern by a factor of ATR. The default ATR percentage is 33% but can be adjusted.
The Stop dot is based on the recent highest high (bearish) or lowest low (bullish) of a set range (default is 9 bars) plus/minus the ATR percentage buffer.
The Target dot is automatically calculated from the entry based on a configurable reward factor (default is 3) from the entry to stop distance. This projects a potential 3:1 reward/risk trade by default.
There is an additional alert condition which can be configured at the end of the script.

ATR Stop Loss IndicatorIt’s very simple – all it does is calculate your stop loss with trailing stop price.
How It Works
Blue is the current ATR (pips).
Green is your trailing stop-loss price for Long
Red is your trailing stop-loss price for Short .
Settings
ATR Length:
Your ATR Length
Multiplier:
ATR multiplier.
For example, if you want to use a 2x ATR stop, set to 2.
ATR color zones with volume radar [LM]Hello Guys,
I would like to introduce you the ATR color zones with volume radar indicator. It's a fork of @GlobalMarketSignals "GMS: Mr. Yen's Color Zone" shout-out to him.
I have enriched it -> that zones are calculated based on the ATR and percentages as described below and volume radar on candle bars. You can select from which timeframe color zones are calculated.
Zones:
white line is the previous period close
red zone = +/- 20% ATR of previous period
yellow zone = +/- 40% ATR of previous period
green zone = +/- 60% ATR of previous period
blue zone = +/- 100% ATR of previous period
Volume radar:
lime = above volume MA average multiplied by multiplier up bar
maroon = above volume MA average multiplied by multiplier down bar
black = volume is decreasing but is not below half of volume MA
navy = volume is decreasing and is below half of volume MA
markers are shown when volume is increasing two consecutive candle in row in direction of the candle
Any suggestions are welcomed

CC - Array-meta Consolidated Interval Display (ACID)This script extends my other two Array examples (which I've also provided to you open source):
The Ticker-centric 5m,15m,45m,1h,4h,1d resolution labels using arrays:
And the more Macro VIX,GLD,TLT,QQQ,SPY,IWM 1d resolution labels using arrays:
This script aims to show how to use min/max/avg with Arrays easily. My next example after this will be exploring the usage of variance versus covariance ratios over different periodic interval resolutions. Currently, this is using the following intervals: 5m,15m,45m,1h,4h,1d. It takes these intervals, calculates the values at those resolutions and puts the absolute min and max from the 5 minute to the 1 day resolutions.
It's more of an example of the power that arrays can hold, as all this truly is right now is a min/max bound calculator. The real gem lies in the avg calculators for multiple resoltuions tied into a single label with readable data. Check out the code and let me know what you think. If you need more examples, the other two scripts I mentioned before are also open source.
Using this on intervals of less than 1D sometimes times out, the way I wrote it is memory intensive, may not work for non-pro users.
Thanks!
NONE OF THIS IS FOREWARD LOOKING STATEMENTS, THIS IS NOT A PREDECTIVE ANALYSIS TOOL. THIS IS A RESEARCH ATTEMPT AT A NOVEL INDICATOR. I am not responsible for outcomes using it.
Please use and give criticisms freely. I am experimenting with combining resolutions and comparing covariance values at different levels right now, so let me know your thoughts! The last indicator will likely not be open source, but may be depending on how complex I get.

ATR + PSAR Trailing Stop (Expo)This ATR + PSAR Trailing Stop indicator is unique. It comes with new ways of calculating ATR and PSAR to enhance performance and accuracy as well as give clarity in trends. The indicator can be used standalone or as a part of your current trading strategy.
ATR + PSAR Trailing Stop (Expo) is a trailing stop indicator that combines ATR and PSAR to enhance the calculation of the trailing stop. This indicator works well in all types of markets, for example, in a trading range or in a trending market, etc.
The user can choose between the following ATR Settings:
Quick ATR
Adaptive ATR
Follow the price closely - ATR
Standard ATR
Trend ATR
The user can enable Trend ATR which displays the overall market structure. If the Trend ATR line is above the price we have a negative market structure, and if the Trend ATR line is below the price we have a positive market structure.
Real-time
No repainting
Works on any market and in any timeframe
HOW TO USE
- Use the ATR + PSAR Trailing Stop as a stop-loss.
- Use the indicator for taking a position when price crosses the ATR trailing line or taking a position when price crosses the PSAR circles.
- Use the indicator to identify the current market structure and trend.
The indicator can be used standalone or as a part of your current trading strategy.
INDICATOR IN ACTION
1-hour chart
I hope you find this indicator useful , and please comment or contact me if you like the script or have any questions/suggestions for future improvements. Thanks!
I will continually work on this indicator, so please share your experience and feedback as it will enable me to make even better improvements. Thanks to everyone that has already contacted me regarding my scripts. Your feedback is valuable for future developments!
-----------------
Disclaimer
Copyright by Zeiierman.
The information contained in my scripts/indicators/ideas does not constitute financial advice or a solicitation to buy or sell any securities of any type. I will not accept liability for any loss or damage, including without limitation any loss of profit, which may arise directly or indirectly from the use of or reliance on such information.
All investments involve risk, and the past performance of a security, industry, sector, market, financial product, trading strategy, or individual’s trading does not guarantee future results or returns. Investors are fully responsible for any investment decisions they make. Such decisions should be based solely on an evaluation of their financial circumstances, investment objectives, risk tolerance, and liquidity needs.
My scripts/indicators/ideas are only for educational purposes!
ACCESS THE INDICATOR
• Contact me on TradingView or use the links below
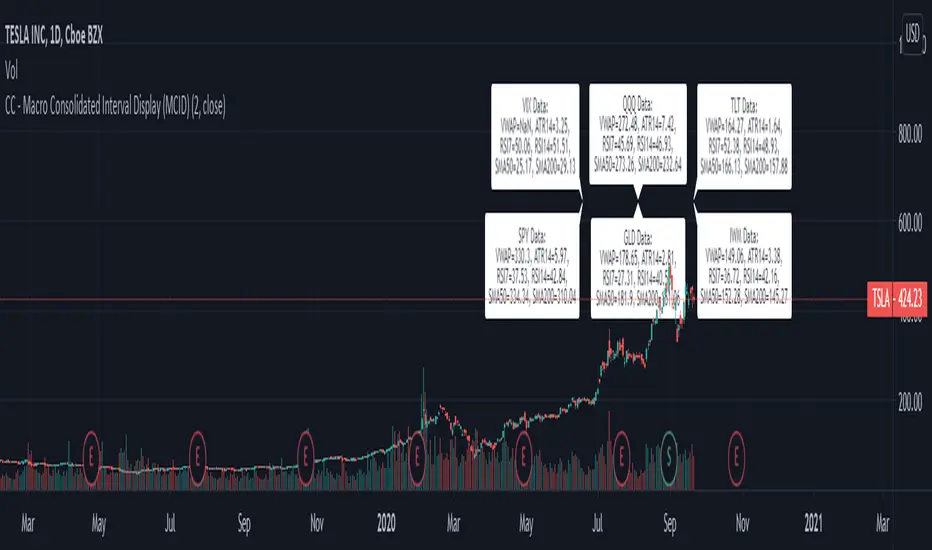
CC - Macro Consolidated Interval Display (MCID)Ever wish you didn't have to rapidly flip between 6 different tickers to get the full picture?
Yeah, me too. Do you also wish that you kind of understood how the shift / unshift function works for arrays?
Yeah, I did too. Both of those birds are taken care of with one stone!
The Macro Consolidated Interval Display uses the new Array structure and security to display data for VIX, GLD, TLT, QQQ, SPY and IWM (at a 1D interval) SIMUTANEOUSLY! Regardless of which ticker you're looking at you can get the full picture of macro futures data without flipping around to get it.
This is my first script trying to use arrays. It basically shows the following a 1d interval:
ATR14, RSI7, RSI14, SMA50, SMA200 and VWAP for VIX.
ATR14, RSI7, RSI14, SMA50, SMA200 and VWAP for GLD.
ATR14, RSI7, RSI14, SMA50, SMA200 and VWAP for TLT.
ATR14, RSI7, RSI14, SMA50, SMA200 and VWAP for QQQ.
ATR14, RSI7, RSI14, SMA50, SMA200 and VWAP for SPY.
ATR14, RSI7, RSI14, SMA50, SMA200 and VWAP for IWM
To make it more or less busy, I've allowed you to toggle off any of the levels you wish. I've also chosen to leave this as open source, as it's nothing too experimental, and I hope that it can gain some traction as an Array example that the public can use! If you don't like the different values that are shown, use this source code example as a spring-board to put values that you do care about onto the labels.
If this code has helped you at all please drop me a like or some constructive criticism if you do not think it's worth a like.
Good luck and happy trading friends. This should be compatible with my CID as well:
If this gets traction, I will post something similar for a dynamic combination of tickers and intervals that you can set yourself.
CC - Consolidated Interval Display (CID)Ever wish you didn't have to rapidly flip between 6 different intervals to get the full picture?
Yeah, me too. Do you also wish that you kind of understood how the shift / unshift function works for arrays?
Yeah, I did too. Both of those birds are taken care of with one stone!
The Consolidated Interval Display uses the new Array structure and security to display data for 5m, 15m, 45m, 1h, 4h and 1d intervals SIMUTANEOUSLY! Regardless of which interval you're looking at you can get the full picture of numerical data without flipping around to get it.
This is my first script trying to use arrays. It basically shows the following for the given ticker:
ATR14, RSI7, RSI14, SMA50, SMA200 and VWAP at the 5 minute level.
ATR14, RSI7, RSI14, SMA50, SMA200 and VWAP at the 15 minute level.
ATR14, RSI7, RSI14, SMA50, SMA200 and VWAP at the 45 minute level.
ATR14, RSI7, RSI14, SMA50, SMA200 and VWAP at the 1 hour level.
ATR14, RSI7, RSI14, SMA50, SMA200 and VWAP at the 4 hour level.
ATR14, RSI7, RSI14, SMA50, SMA200 and VWAP at the 1 day level.
To make it more or less busy, I've allowed you to toggle off any of the levels you wish. I've also chosen to leave this as open source, as it's nothing too experimental, and I hope that it can gain some traction as an Array example that the public can use! If you don't like the different values that are shown, use this source code example as a spring-board to put values that you do care about onto the labels.
If this code has helped you at all please drop me a like or some constructive criticism if you do not think it's worth a like.
Good luck and happy trading friends.
If this gets traction, I will post something similar for a combination of SPY, VIX, GOLD, QQQ, IWM and TLT.

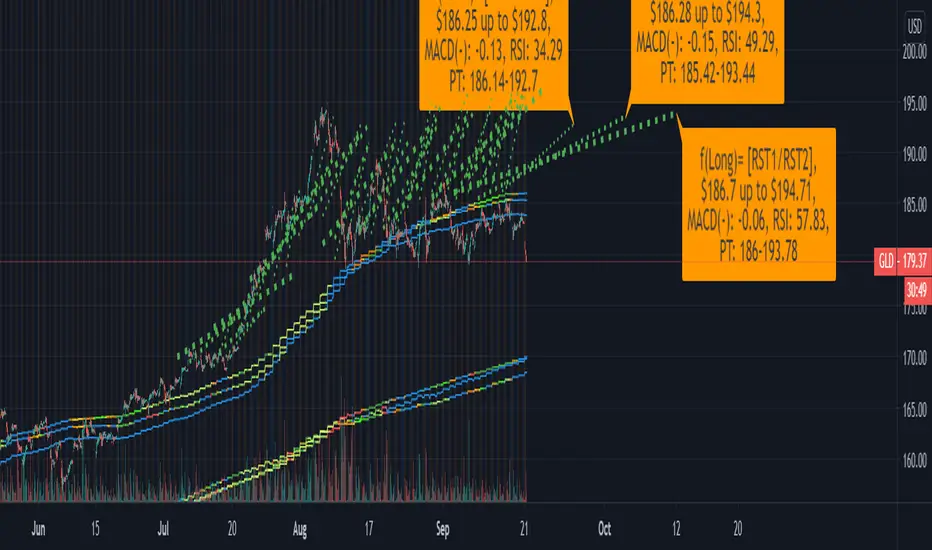
CC - ATP (Auto-Trendline Projection)I created this script with a simple goal in mind: Automatically plot trend-lines for a given interval with a resolution that fits the period chosen.
To accomplish this I used a combination of the following:
Ichimoku Spans and Ichimoku Span Width.
ATR and standard deviation from the ATR of the Ichimoku width.
Rolling MACD with directional RSI for coloration based on acceleration.
I then combined all of these pieces of data into a single label and line plotter, so that you can see the assumed trend-lines for the current period based on the interval selected. It attempts to avoid using look-ahead logic by resolving using security, and plotting based on the suggested methodologies.
Inputs:
n (this must be the smallest number). - This is usually 7,14 or 26 depending on the resolution you're going for.
m (must be m > n and m < o). - This is usually something close to 14,26 or 52.
o (must be o > m and o < p). - This is usually something close to 26,52 or 180.
p (must be p > o). - This is usually just o * 2 or 52, 180 or 360.
Show historical data - Keeps some of the lagging trend-lines at intervals of m, o and p.
Precision - The decimal precision to round to, useful if you need this for BTC or penny stocks.
Common Inputs I use:
n=7, m=14, o=26, p=52
n=14, m=26, o=52, p=180
n=26, m=52, o=180, p=360
You can use any numbers, but roughly you want:
m = n*2, o = m*2, p = o*2.
The labels contain the following information:
Expected Support/Resistance levels
The first level is assumed to be heading to the second level.
For instance, if you have S1 down to R2, that means a support is likely to become a resist.
If you have, instead, R1 up to R2 that means the resistance is moving up, but is still resist.
S1 down to S2 is similar in that it means the support level is moving lower but is still sup.
R1 up to S2 is the one that you want to look for as it indicates potential swings.
More-overly, R1-->S2 or S1-->R1 indicate pivotal moments.
MACD / RSI for the given period.
Pretty simple, it's given to the number of decimal places offered by the inputs.
Price Targets.
If it's above the price target area, that means the swing already probably happened.
If it's in the price target area, you're at a pivotal moment; it could go up or down.
If you're below the price target area, watch for catalysts that force price target entry.
WARNING:
Please note, all of this is trend analysis and can be completely demolished in an instant by a catalyst. If there is a huge retracement event, you MUST WAIT A MINIMUM OF THE INPUT PERIOD OF TIME FOR THE STOCK TO SETTLE. If you have a retracement within n-m periods for instance, the short data will be inaccurate. If you have a retracement from m-o the mid data may be inaccurate until it triggers retracement. Same with o-p on the long level. The higher numbers you use, the less reactive the script, but the more historical data it will consume. For instance high numbers may be good for amazon, so you have less reaction to big dips, as you are not afraid because it is a strong company. While this is good on strong companies, it is suicidal for unknown ones.
DISCLAIMER:
I do NOT state anywhere that the data provided by this indicator is valid, forward looking, or guaranteed. If you make a trade based on this indicator I am in no way responsible for the outcome. All trades should be backed by personal due diligence and not rely directly on the indicators of others, as they may contain unfound bugs, incorrect math or look-ahead logic that is potentially dangerous. One final disclaimer, I am a programmer at heart, and am new to this field of study. While I have found a group of supportive friends, do realize I have been at this for less time than most others, more notably I started on 8/16/2020. Please shower me with constructive criticism and other thoughts you have.
Please take this script and view it as a learning experience not a tool for money as of this moment, if you have further questions about me or my scripts, please feel free to message me.