Argentina FX BandsEN
This indicator plots Argentina's FX band system implemented by the BCRA starting April 11, 2025. It shows the floor and ceiling for the ARS/USD exchange rate. Inside the band, the rate floats. Touching the floor implies USD buying; touching the ceiling implies USD selling.
Phase rules:
- Phase 1 (Apr 11, 2025 to Dec 31, 2025): floor moves -1% per month, ceiling moves +1% per month
- Phase 2 (Jan 1, 2026 onward): both bands adjust by inflation with a 2-month lag (T-2)
Projections: next month's inflation is assumed equal to the latest known inflation unless you enter a custom value.
Disclaimer: Educational only. No investment advice.
---
ES
Bandas Cambiarias BCRA - Fase 3
Este indicador grafica el esquema de bandas cambiarias implementado por el BCRA a partir del 11 de abril de 2025. Muestra el piso y el techo del tipo de cambio ARS/USD y su evolucion en el tiempo.
Reglas por fase:
- Fase 1 (11 Abr 2025 a 31 Dic 2025): el piso baja 1% mensual y el techo sube 1% mensual
- Fase 2 (desde 1 Ene 2026): ambas bandas se ajustan por inflacion con rezago T-2 (2 meses)
Proyecciones: se asume que la inflacion del proximo mes es igual a la ultima inflacion conocida, salvo que ingreses un valor personalizado.
Aviso legal: Solo informativo y educativo. Eco Valores S.A. no brinda asesoramiento ni recomendaciones de inversion. Consulte a un profesional calificado antes de invertir.
Bandas

Super Arma Institucional PRO v6.3Super Arma Institucional PRO v6.3
Description
Super Arma Institucional PRO v6.3 is a multifunctional indicator designed for traders looking for a clear and objective analysis of the market, focusing on trends, key price levels and high liquidity zones. It combines three essential elements: moving averages (EMA 20, SMA 50, EMA 200), dynamic support and resistance, and volume-based liquidity zones. This integration offers an institutional view of the market, ideal for identifying strategic entry and exit points.
How it Works
Moving Averages:
EMA 20 (orange): Sensitive to short-term movements, ideal for capturing fast trends.
SMA 50 (blue): Represents the medium-term trend, smoothing out fluctuations.
EMA 200 (red): Indicates the long-term trend, used as a reference for the general market bias.
Support and Resistance: Calculated based on the highest and lowest prices over a defined period (default: 20 bars). These dynamic levels help identify zones where the price may encounter barriers or supports.
Liquidity Zones: Purple rectangles are drawn in areas of significantly above-average volume, indicating regions where large market participants (institutional) may be active. These zones are useful for anticipating price movements or order absorption.
Purpose
The indicator was developed to provide a clean and institutional view of the market, combining classic tools (moving averages and support/resistance) with modern liquidity analysis. It is ideal for traders operating swing trading or position trading strategies, allowing to identify:
Short, medium and long-term trends.
Key support and resistance levels to plan entries and exits.
High liquidity zones where institutional orders can influence the price.
Settings
Show EMA 20 (true): Enables/disables the 20-period EMA.
Show SMA 50 (true): Enables/disables the 50-period SMA.
Show EMA 200 (true): Enables/disables the 200-period EMA.
Support/Resistance Period (20): Sets the period for calculating support and resistance levels.
Liquidity Sensitivity (20): Period for calculating the average volume.
Minimum Liquidity Factor (1.5): Multiplier of the average volume to identify high liquidity zones.
How to Use
Moving Averages:
Crossovers between the EMA 20 and SMA 50 may indicate short/medium-term trend changes.
The EMA 200 serves as a reference for the long-term bias (above = bullish, below = bearish).
Support and Resistance: Use the red (resistance) and green (support) lines to identify reversal or consolidation zones.
Liquidity Zones: The purple rectangles highlight areas of high volume, where the price may react (reversal or breakout). Consider these zones to place orders or manage risks.
Adjust the parameters according to the asset and timeframe to optimize the analysis.
Notes
The chart should be configured only with this indicator to ensure clarity.
Use on timeframes such as 1 hour, 4 hours or daily for better visualization of liquidity zones and support/resistance levels.
Avoid adding other indicators to the chart to keep the script output easily identifiable.
The indicator is designed to be clean, without explicit buy/sell signals, following an institutional approach.
This indicator is perfect for traders who want a visually clear and powerful tool to trade based on trends, key levels and institutional behavior.

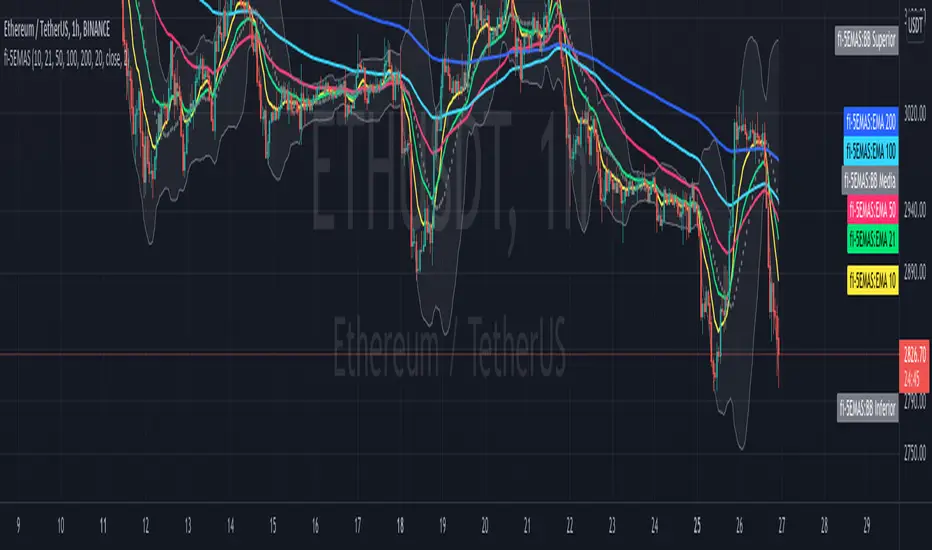
fi - 5EMA + BB - 5 emas en un mismo indicador junto con las bandas de bollinguer.
- Opcion de timeframe
- Actualizado a version 5
//Indicador adaptado a medida sobre "4EMA lines EMA Cross @Philacone + Bollinger Bands by Alessiof"
//Todos los méritos para Alessiof, muchas gracias!!!