ADX Volatility Waves [BOSWaves]ADX Volatility Waves - Trend-Weighted Volatility Mapping with State-Based Wave Transitions
Overview
ADX Volatility Waves is a regime-aware volatility framework designed to map statistically significant price extremes through adaptive wave structures driven by trend strength.
Rather than treating volatility as a static dispersion metric, this indicator conditions all volatility expansion, contraction, and zone placement on ADX-derived trend intensity. Price behavior is interpreted through wave-like transitions between balance, expansion, and exhaustion states rather than isolated band interactions.
The result is a dynamic, gradient-based wave system that visually encodes volatility cycles and regime shifts in real time, allowing traders to contextualize price movement within trend-weighted volatility waves.
Price is evaluated not by static thresholds, but by its position and progression within adaptive volatility waves shaped by directional strength.
Conceptual Framework
ADX Volatility Waves is built on the premise that volatility unfolds in waves, not straight lines.
Traditional volatility tools identify dispersion but fail to account for how volatility behaves differently across trend regimes. By embedding ADX directly into volatility construction, this indicator ensures that volatility waves expand during strong directional phases and compress during weak or transitioning regimes.
Three guiding principles define the framework:
Volatility must be conditioned on trend strength
Extremes occur within zones, not at lines
Signals should emerge from completed wave transitions, not instantaneous touches
This reframes analysis from reactive mean-reversion toward regime-aware wave interpretation.
Theoretical Foundation
The indicator fuses directional movement theory with statistical volatility modeling.
Bollinger-derived dispersion provides the structural base, while ADX normalization controls the amplitude of volatility waves. As ADX increases, volatility waves widen and deepen; as ADX weakens, waves compress and tighten around equilibrium.
From this foundation, extended upper and lower wave zones are constructed and smoothed to represent statistically significant expansion and contraction phases.
At its core are three interacting systems:
ADX-Controlled Volatility Engine : Standard deviation is dynamically scaled using normalized ADX values, producing trend-weighted volatility waves.
Wave Zone Construction : Smoothed volatility boundaries are offset and expanded to form upper and lower wave zones, defining overextension and compression regions.
State-Based Wave Transition Logic : Signals occur only after price completes a full wave cycle: expansion into an extreme wave zone followed by a confirmed return to equilibrium.
This structure ensures that signals reflect completed volatility waves, not transient noise.
How It Works
ADX Volatility Waves processes price action through layered wave mechanics:
Trend-Weighted Volatility Calculation : Volatility boundaries are dynamically adjusted using ADX influence, allowing wave amplitude to scale with trend strength.
Structural Smoothing : Volatility boundaries are smoothed to stabilize wave geometry and reduce short-term distortions.
Wave Offset & Expansion : Upper and lower wave zones are positioned beyond equilibrium and expanded proportionally to volatility range, forming clearly defined expansion waves.
Gradient Wave Depth Mapping : Each wave zone is subdivided into multiple gradient layers, visually encoding increasing extremity as price moves deeper into a wave.
Wave State Tracking & Cooldown Control : The system tracks prior wave occupancy, enforces neutral stabilization periods, and applies cooldowns to prevent overlapping wave signals.
Compression Detection : Volatility width monitoring identifies compression phases, highlighting conditions where new volatility waves are likely to form.
Together, these processes create a continuous, adaptive wave map of volatility behavior.
Interpretation
ADX Volatility Waves reframes market reading around volatility cycles:
Upper Volatility Waves (Red Gradient) : Represent upside expansion phases. Deeper wave penetration indicates increased overextension relative to trend-adjusted volatility.
Lower Volatility Waves (Green Gradient) : Represent downside expansion phases. Sustained presence signals pressure, while exits toward balance suggest wave completion.
Equilibrium Zone : The neutral region between volatility waves. Confirmed re-entry into this zone marks the completion of a wave cycle and forms the basis for BUY and SELL signals.
Regime Context via ADX : Strong ADX regimes widen waves, reducing premature reversal signals. Weak ADX regimes compress waves, increasing sensitivity to reversion.
Wave progression and completion matter more than single-bar interactions.
Signal Logic & Visual Cues
ADX Volatility Waves produces single-entry BUY and SELL labels as its visual cues, plotted only when price first enters a volatility wave zone after the defined cooldown period.
Buy Signal (Bottom Zone Entry) : A BUY label appears when price enters the lower volatility wave (oversold zone). This highlights potential expansion into undervalued extremes, providing visual context for trend assessment rather than a guaranteed execution trigger.
Sell Signal (Top Zone Entry) : A SELL label appears when price enters the upper volatility wave (overbought zone). This marks potential overextension into upper volatility extremes, serving as a contextual indicator of trend stress.
All labels respect cooldown tracking to prevent clustering. Alerts are tied directly to these zone-entry signals, and a separate alert monitors volatility squeezes for awareness of compression periods.
Strategy Integration
ADX Volatility Waves integrates cleanly into volatility-aware trading frameworks:
Wave Context Mapping : Use wave depth to assess expansion and exhaustion risk rather than forcing immediate entries.
Transition-Based Execution : Prioritize BUY and SELL signals formed after confirmed wave completion.
Trend-Regime Filtering : In strong ADX regimes, treat waves as continuation pressure. In weak regimes, favor completed wave reversions.
Volatility Cycle Awareness : Monitor compression phases to anticipate the emergence of new volatility waves.
Multi-Timeframe Alignment : Apply higher-timeframe ADX regimes to contextualize lower-timeframe wave behavior.
Technical Implementation Details
Core Engine : ADX-normalized volatility expansion
Wave System : Smoothed, offset, expanded volatility waves
Visualization : Multi-layer gradient wave zones
Signal Logic : State-based wave transitions with cooldown enforcement
Alerts : Wave entry, wave completion, volatility compression
Performance Profile : Lightweight, real-time optimized overlay
Optimal Application Parameters
Timeframe Guidance:
1 - 5 min : Short-term volatility waves and intraday transitions
15 - 60 min : Structured intraday wave cycles
4H - Daily : Macro volatility regimes and expansion phases
Suggested Baseline Configuration:
BB Length : 20
BB StdDev : 1.5
ADX Length : 14
ADX Influence : 0.8
Wave Offset : 1.0
Wave Width : 1.0
Neutral Confirmation : 5 bars
These suggested parameters should be used as a baseline; their effectiveness depends on the asset volatility, liquidity, and preferred entry frequency, so fine-tuning is expected for optimal performance.
Performance Characteristics
High Effectiveness:
Markets exhibiting rhythmic volatility expansion and contraction
Assets with responsive ADX regime behavior
Reduced Effectiveness:
Erratic, news-driven price action
Illiquid markets with distorted volatility metrics
Integration Guidelines
Confluence : Combine with BOSWaves structure or trend tools
Discipline : Respect wave completion and cooldown logic
Risk Framing : Interpret wave depth probabilistically, not predictively
Regime Awareness : Always contextualize waves within ADX strength
Disclaimer
ADX Volatility Waves is a professional-grade volatility and regime-mapping tool. It does not predict price and does not guarantee profitability. Performance depends on market conditions, parameter calibration, and disciplined execution. BOSWaves recommends using this indicator as part of a comprehensive analytical framework incorporating trend, volatility, and structural context.
Полосы и каналы

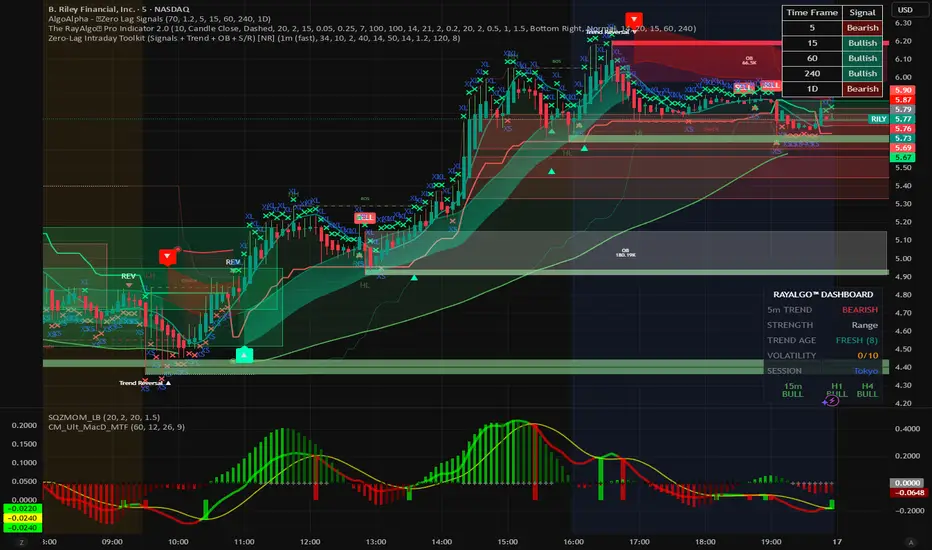
ZERO-LAG Tabrizi Scalping ToolKit This indicator will allow you to scalp on the 1M and 5M chart with zero lag. We will show you trend reversals and also when to buy and sell
Scalping Signals with MTF Fibo BandsThis indicator is a scalping / intraday signal system built on Multi-Timeframe (MTF) Fibonacci Bands, combined with an RSI midline filter and an optional direction-lock mechanism to reduce consecutive losing entries.
🔹 What does this indicator do?
It plots two independent Fibonacci Band sets (A & B), each calculated from a higher timeframe SMA + ATR.
Entry zones are defined between Band 2 and Band 3, representing statistically extreme price areas.
You can choose to generate signals from:
Band A only
Band B only
BOTH (A + B confirmation)
📈 Entry Logic
LONG
Price closes inside the Lower Zone (between Fib2 Lower & Fib3 Lower)
RSI is above the midline (default 50)
SHORT
Price closes inside the Upper Zone (between Fib2 Upper & Fib3 Upper)
RSI is below the midline (default 50)
🟧 Direction Lock System
If enabled, the indicator locks the trade direction when a position hits Stop Loss before reaching TP1.
This prevents repeated entries in the same direction during unfavorable conditions.
🔓 Unlock Logic
The lock can be removed when:
RSI crosses back over the midline (RSI > 50 for LONG, RSI < 50 for SHORT)
AND price closes again inside the valid Band 2–3 zone
With the optional setting enabled, a new entry can occur on the same candle
🛑 Stop Loss Logic (Important)
This indicator uses price-action-based stop logic, not fixed pip stops.
1️⃣ Before TP1
LONG: Two consecutive candle closes below Fib3 Lower
SHORT: Two consecutive candle closes above Fib3 Upper
⚠️ Because SL depends on candle closes, you must monitor lower timeframes (1m or below) to react quickly and avoid delayed exits.
2️⃣ After TP1 (Break-Even Protection)
Once TP1 is touched:
SL automatically shifts to Break-Even (entry price)
Any return to entry will close the position
⚠️ Usage Warning
This indicator is NOT designed for sharp, explosive, or news-driven moves
Avoid using it during:
High-impact news
Extremely fast impulsive candles
Sudden volatility spikes
Best performance is achieved in structured price action environments, not chaotic market conditions.

TTM Squeeze Candles (Custom Colors) with Dynamic Strength BarHere is my tribute, tip of the cap to one of the greatest traders of our generation John F. Carter
It was my goal to try and simply visualize the squeeze with candle sticks, dynamic momentum, and signals all on one chart in one indicator. Please study and master the squeeze setup before trying to apply this indicator . You must have a deep understanding of how to trade the squeeze. Read "Mastering The Trade " watch JC's videos etc, and practice with a simulated or paper account before ever trying out new strategies with real money. Not financial advice, I am not a financial advisor! DYOR- with that said - I hope you like it :)
TTM squeeze candles **custom TradingView Pine Script (v6)** indicator that visualizes the **TTM Squeeze** strategy — a popular volatility-based momentum system originally developed by John Carter of TradeTheMarkets (TTM). This version enhances the classic TTM Squeeze with **custom candle coloring**, **dynamic momentum strength**, **visual alerts**, and a **real-time strength meter**.
---
## OVERVIEW: What is the TTM Squeeze?
The **TTM Squeeze** identifies periods when **volatility is contracting** (price is consolidating), followed by a **potential explosive breakout** when volatility expands.
It combines:
1. **Bollinger Bands (BB)** – measure statistical volatility
2. **Keltner Channels (KC)** – measure average true range (ATR) volatility
3. **Momentum Oscillator** – determines direction and strength of potential breakout
> **Squeeze ON** = BB inside KC → Low volatility (consolidation)
> **Squeeze OFF** = BB outside KC → Volatility expanding (breakout possible)
## BEST USED ON
- **Timeframes**: 15m, 1H, 4H, Daily
- **Markets**: Stocks, Forex, Crypto, Futures
- **Pairs well with**: Volume, VWAP, Support/Resistance
---
## SUMMARY
> **This is a highly visual, trader-friendly squeeze candle indicator that:
> - **Colors candles** based on squeeze state and momentum strength
> - **Shows real-time momentum intensity** via histogram + strength bar
> - **Alerts on squeeze start/release**
> - **Normalizes momentum** for fair strength comparison
> - **Provides clean, actionable signals** for breakout trading
---
**Ideal for swing traders and day traders** looking to catch **high-momentum breakouts from low-volatility consolidations** with **clear entry signals and conviction levels**.

Volume MAs Oscillator | Lyro RS// This Pine Script® code is subject to the terms of the Mozilla Public License 2.0 at mozilla.org
// © LyroRS
//@version=6
indicator("Volume MAs Oscillator | Lyro RS")
import LyroRS/LMAs/1 as DynamicMAs
//─────────────────────────────────────────────────────────────────────────────────────────────────────────────
//─██████─────────████████──████████─████████████████───██████████████───────████████████████───██████████████─
//─██░░██─────────██░░░░██──██░░░░██─██░░░░░░░░░░░░██───██░░░░░░░░░░██───────██░░░░░░░░░░░░██───██░░░░░░░░░░██─
//─██░░██─────────████░░██──██░░████─██░░████████░░██───██░░██████░░██───────██░░████████░░██───██░░██████████─
//─██░░██───────────██░░░░██░░░░██───██░░██────██░░██───██░░██──██░░██───────██░░██────██░░██───██░░██─────────
//─██░░██───────────████░░░░░░████───██░░████████░░██───██░░██──██░░██───────██░░████████░░██───██░░██████████─
//─██░░██─────────────████░░████─────██░░░░░░░░░░░░██───██░░██──██░░██───────██░░░░░░░░░░░░██───██░░░░░░░░░░██─
//─██░░██───────────────██░░██───────██░░██████░░████───██░░██──██░░██───────██░░██████░░████───██████████░░██─
//─██░░██───────────────██░░██───────██░░██──██░░██─────██░░██──██░░██───────██░░██──██░░██─────────────██░░██─
//─██░░██████████───────██░░██───────██░░██──██░░██████─██░░██████░░██───────██░░██──██░░██████─██████████░░██─
//─██░░░░░░░░░░██───────██░░██───────██░░██──██░░░░░░██─██░░░░░░░░░░██───────██░░██──██░░░░░░██─██░░░░░░░░░░██─
//─██████████████───────██████───────██████──██████████─██████████████───────██████──██████████─██████████████─
//─────────────────────────────────────────────────────────────────────────────────────────────────────────────
// LyroRS v1.0
// Groups
ma_g = "𝗠𝗢𝗩𝗜𝗡𝗚 𝗔𝗩𝗘𝗥𝗔𝗚𝗘"
bands_g = "𝗕𝗔𝗡𝗗"
display_g = '𝗗𝗜𝗦𝗣𝗟𝗔𝗬'
// Inputs
// -- Moving Average
source = input.source(close, "Source", group= ma_g, tooltip= "Select where the data originates (open, high, low, close, etc..).")
ma_type = input.string("EMA", "Select Moving Average", options= , group=ma_g, tooltip="Choose a moving average type to apply to the price multiplied by volume. VWMA already incorporates volume directly.")
ma_length = input.int(30, "Moving Average Length", group= ma_g, tooltip= "Defines the length or period of the selected moving average.")
// -- Bands
band_length = input.int(27, "Band Length", group=bands_g, tooltip="Number of bars used to calculate standard deviation.")
band_smoothing = input.float(0.8, "Band Smoothing", group=bands_g, minval=0, tooltip="Smooths the band edges to reduce noise.")
pbm = input.float(1.8, "Positive Band Multiplier", group=bands_g, minval=0, tooltip="Multiplier for the upper band distance.")
nbm = input.float(-0.85, "Negative Band Multiplier", group=bands_g, maxval=0, tooltip="Multiplier for the lower band distance.")
// Color Inputs
signal_type = input.string("Trend", "Select Signal Type", options= , group=display_g, tooltip="Select which way to use the indicator.")
ColMode = input.string("Mystic", "Custom Color Palette", inline="drop", options= , display=display.none, group= display_g, tooltip="Select a predefined color scheme for the indicator display. (Major Themes color mode automatically switches colors based on the major asset you picked for valuation analysis.)")
cpyn = input.bool (true, "Use Custom Palette", group= display_g, display=display.none, tooltip="Enables custom color selection for signals.")
cp_UpC = input.color (#00ff00, "Custom Up", inline = "Custom Palette", group= display_g, display=display.none, tooltip="")
cp_DnC = input.color (#ff0000, "Custom Down", inline = "Custom Palette", group= display_g, display=display.none, tooltip="User specifed bullish and bearish colors.")
d_obos_sigs = input.bool (true, "Display Oversold/Overbought Signs", group= display_g, display=display.none, tooltip="Enables triangle signs to be displayed.")
d_signs = input.bool (true, "Display Signs", group= display_g, display=display.none, tooltip="Enables signs for Trend mode.")
d_bgcol = input.bool (true, "Display Background Color", group= display_g, display=display.none, tooltip="Enables background color for Reversion & Valuation mode.")
// Colors
color UpC = na
color DnC = na
// -- Predefined Colors
switch ColMode
"Classic" =>
UpC := #00E676
DnC := #880E4F
"Mystic" =>
UpC := #30FDCF
DnC := #E117B7
"Accented" =>
UpC := #9618F7
DnC := #FF0078
"Royal" =>
UpC := #FFC107
DnC := #673AB7
// -- Custom Colors
if cpyn
UpC := cp_UpC
DnC := cp_DnC
// Coloring Function for Valuation
coloring(src) =>
color.from_gradient(src, ta.lowest(src, band_length), ta.highest(src, band_length), UpC, DnC)
// Moving Average Switch
float ma = na
switch ma_type
"SMA" => ma := DynamicMAs.SMA(source * volume, ma_length) / DynamicMAs.SMA(volume, ma_length)
"EMA" => ma := DynamicMAs.EMA(source * volume, ma_length) / DynamicMAs.EMA(volume, ma_length)
"WMA" => ma := DynamicMAs.WMA(source * volume, ma_length) / DynamicMAs.WMA(volume, ma_length)
"VWMA" => ma := DynamicMAs.VWMA(source, volume, ma_length) // Already Volume Based MA
"DEMA" => ma := DynamicMAs.DEMA(source * volume, ma_length) / DynamicMAs.DEMA(volume, ma_length)
"TEMA" => ma := DynamicMAs.TEMA(source * volume, ma_length) / DynamicMAs.TEMA(volume, ma_length)
"RMA" => ma := DynamicMAs.RMA(source * volume, ma_length) / DynamicMAs.RMA(volume, ma_length)
"HMA" => ma := DynamicMAs.HMA(source * volume, ma_length) / DynamicMAs.HMA(volume, ma_length)
"LSMA" => ma := DynamicMAs.LSMA(source * volume, ma_length, 0) / DynamicMAs.LSMA(volume, ma_length, 0)
"SMMA" => ma := DynamicMAs.SMMA(source * volume, ma_length) / DynamicMAs.SMMA(volume, ma_length)
"ALMA" => ma := DynamicMAs.ALMA(source * volume, ma_length, 0, 20) / DynamicMAs.ALMA(volume, ma_length, 0, 20)
"ZLSMA" => ma := DynamicMAs.ZLSMA(source * volume, ma_length) / DynamicMAs.ZLSMA(volume, ma_length)
"FRAMA" => ma := DynamicMAs.FRAMA(source * volume, ma_length) / DynamicMAs.FRAMA(volume, ma_length)
"KAMA" => ma := DynamicMAs.KAMA(source * volume, ma_length) / DynamicMAs.KAMA(volume, ma_length)
"JMA" => ma := DynamicMAs.JMA(source * volume, ma_length, 0) / DynamicMAs.JMA(volume, ma_length, 0)
"T3" => ma := DynamicMAs.T3(source * volume, ma_length, 0.5) / DynamicMAs.T3(volume, ma_length, 0.5)
price_diff = ((source - ma) / ma) * 100 // Percentage Difference between Source and the Moving Average of the source
// Calculations for the Bands
std = ta.stdev(price_diff, band_length)
upperBandRaw = std * pbm
lowerBandRaw = std * nbm
var float upperBand = na
var float lowerBand = na
// Smooth
upperBand := upperBandRaw * band_smoothing + nz(upperBand ) * (1 - band_smoothing)
lowerBand := lowerBandRaw * band_smoothing + nz(lowerBand ) * (1 - band_smoothing)
// Plot Color
var color pc = na
var color uB_color = na
var color lB_color = na
var int signal = 0
if signal_type == "Trend"
uB_color := UpC
lB_color := DnC
if price_diff > upperBand
pc := UpC
signal := 1
if price_diff < lowerBand
pc := DnC
signal := -1
if signal_type == "Reversion"
uB_color := DnC
lB_color := UpC
if price_diff > upperBand
pc := DnC
signal := -1
else if price_diff < lowerBand
pc := UpC
signal := 1
else
pc := color.gray
signal := 0
if signal_type == "Valuation"
uB_color := UpC
lB_color := DnC
pc := coloring(price_diff)
// Plot
plot(price_diff, color= pc, linewidth = 2, title= "Volume MAs Oscillator")
plot(upperBand, color= color.new(uB_color, 50), title= "Upper Band")
plot(lowerBand, color= color.new(lB_color, 50), title= "Lower Band")
plot(0, color= color.new(pc, 60), linewidth = 2, display= display.pane, title= "Mid Line")
plot(0, color= color.new(pc, 75), linewidth = 5, display= display.pane, title= "Mid Line Glow 1")
plot(0, color= color.new(pc, 85), linewidth = 10, display= display.pane, title= "Mid Line Glow 2")
plotchar(upperBand + 0.5, char='▼', color= ta.crossunder(price_diff, upperBand) ? DnC : na, location=location.absolute, title= "Overbought Signal", display= d_obos_sigs ? display.pane : display.none, size= size.tiny)
plotchar(lowerBand - 0.5, char='▲', color= ta.crossover(price_diff, lowerBand) ? UpC : na, location=location.absolute, title= "Oversold Signal", display= d_obos_sigs ? display.pane : display.none, size= size.tiny)
reversion_enable = signal_type == "Reversion"
valuation_enable = signal_type == "Valuation"
bgcolor(d_bgcol and ((valuation_enable and price_diff > upperBand) or (reversion_enable and ta.crossunder(price_diff, upperBand))) ? color.new(DnC, 85) : na, title= "BG Color OB")
bgcolor(d_bgcol and ((valuation_enable and price_diff > upperBand) or (reversion_enable and ta.crossunder(price_diff, upperBand))) ? color.new(DnC, 85) : na, title= "BG Color OB Overlay", force_overlay = true)
bgcolor(d_bgcol and ((valuation_enable and price_diff < lowerBand) or (reversion_enable and ta.crossover(price_diff, lowerBand))) ? color.new(UpC, 85) : na, title= "BG Color OS")
bgcolor(d_bgcol and ((valuation_enable and price_diff < lowerBand) or (reversion_enable and ta.crossover(price_diff, lowerBand))) ? color.new(UpC, 85) : na, title= "BG Color OS Overlay", force_overlay = true)
plotshape(ta.crossover(signal, 0), title="Buy Signal", location=location.belowbar,
style=shape.labelup, text="𝓛𝓸𝓷𝓰", textcolor=#000000, size=size.small,
color=UpC, force_overlay=true, display= signal_type == "Trend" and d_signs == true ? display.pane : display.none)
plotshape(ta.crossunder(signal, 0), title="Sell Signal", location=location.abovebar,
style=shape.labeldown, text="𝓢𝓱𝓸𝓻𝓽", textcolor=#000000, size=size.small,
color=DnC, force_overlay=true, display= signal_type == "Trend" and d_signs == true ? display.pane : display.none)
plotcandle(open, high, low, close, color= pc, wickcolor = pc, bordercolor = pc, force_overlay = true, display= display.pane, title= "Plot Candle")
barcolor(pc, title= "Barcolor")
// ==========================================================================================
// === Dashboard with Telegram Link ===
var table myTable = table.new(position.top_center, 1, 1, border_width=1, frame_color=color.black, bgcolor=color.white)
// Add Telegram Message to Dashboard
table.cell(myTable, 0, 0, "Join Telegram @mrexpert_ai", bgcolor=color.blue, text_color=color.white, text_size=size.normal)

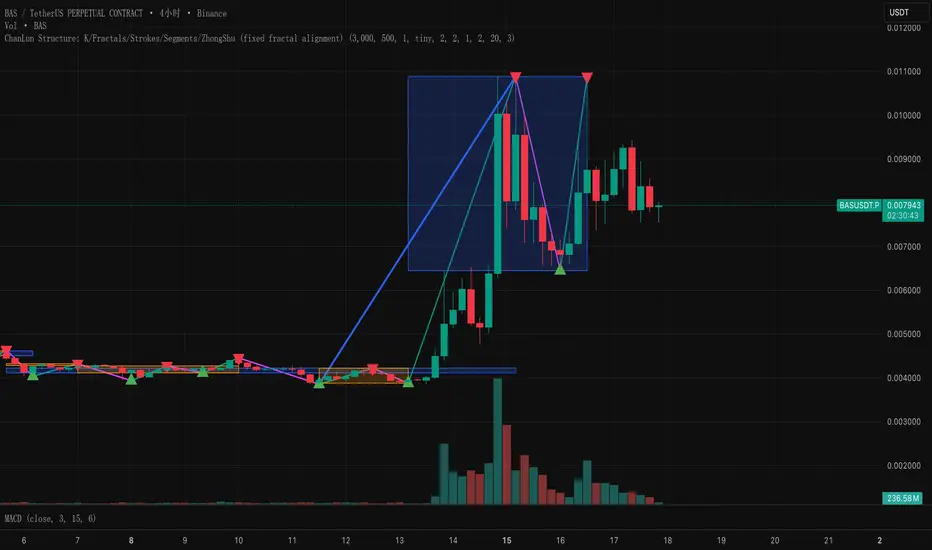
ChanLun Structure: K/Fractals/Strokes/Segments/ZhongShuThis script implements the "line and center" concept of CHANLUN.
Premarket High Low 4:00 at 9:30 AMThis indicator is designed for scalping in 2-minute intervals, taking into account that trading should occur after an SMA 13 / SMA 20 / SMA 200 compression.

Advance SMC (Milad Tayefi)Smart money indicator which recognizes market structure and produces buy/sell signals.

Varun's StrategyBuy and Sell strategy designed for a 1 minute chart to buy when RSI drops under 25 and sell when RSI exceeds 75

NQ bands 50/65.5/100this is a indicator that puts lines 50 points above and below price, 65.5 points above and below price and 100 points above and below price for the Nasdaq Futures.

Daily & Pre-Market Key Levels (v5)Plots:
- Today's high/low
- Pre-market High/Low
- Yesterday's high/low/close
- Day before yesterday high/low

SUPER SPX T.SHere is the professional English description for your indicator. You can use this if you want to save the script in your TradingView library or share it with others.
### **Indicator Name:** `SPX Pro: EMA Crossover with RSI Filter`
### **Description:**
This indicator is specifically optimized for **SPX (S&P 500)** trading, particularly for options traders (CALL/PUT). It combines trend-following moving averages with a momentum filter to identify high-probability entry points.
---
### **Key Features:**
* **Dual EMA Engine:** Uses a **9-period Exponential Moving Average (Fast)** and a **21-period Exponential Moving Average (Slow)**. These are the standard benchmarks for identifying short-term momentum on the SPX.
* **RSI Momentum Filter:** Unlike standard crossover indicators, this script includes a built-in **Relative Strength Index (RSI)** filter.
* **CALL signals** are only generated if the RSI is below 65 (preventing buying at the absolute peak).
* **PUT signals** are only generated if the RSI is above 35 (preventing selling at the absolute bottom).
* **Visual Signals:** * **Green Triangle + "CALL":** Triggered when the 9 EMA crosses above the 21 EMA while the RSI allows for more upside.
* **Red Triangle + "PUT":** Triggered when the 9 EMA crosses below the 21 EMA while the RSI allows for more downside.
* **Clean Interface:** Displays the EMAs clearly on the chart to help identify dynamic support and resistance levels.
---
### **How to Use:**
1. **Timeframe:** Recommended for **5-minute** and **15-minute** charts for day trading.
2. **Confirmation:** Look for the signal to appear after the candle closes to ensure the crossover is confirmed.
3. **Strategy:** This indicator works best when the SPX is trending. During a "sideways" or "choppy" market, the RSI filter will help eliminate many false signals that standard crossovers usually fail to catch.
---
**Next Step:**
Would you like me to add a **"Table"** on the corner of the screen that shows the current RSI value and the trend status (Bullish/Bearish) so you don't have to keep looking at the bottom of the chart?


GS Volume Truth Serum (With Alerts)this tells you when institutions are behind a move and its not a bull trap

FX Session High/Low Bands - Last 5 EST Days
FX Session High/Low Bands - Last 5 Days
Description:
This indicator plots horizontal bands representing the high and low price levels from the major forex trading sessions over the last 5 days. It helps traders identify key support and resistance zones based on recent session activity.
Features:
Multiple Session Tracking: Displays high/low levels for major FX sessions:
Asian Session (Tokyo)
European Session (London)
US Session (New York)
5-Day Lookback: Captures the highest high and lowest low from each session over the previous 5 trading days
Visual Bands: Clear horizontal lines or filled zones showing session boundaries
Dynamic Updates: Automatically recalculates as new session data becomes available
How to Use:
Support/Resistance: Previous session highs/lows often act as key price levels
Breakout Trading: Watch for price breaking above/below session bands
Range Trading: Trade within the bands during consolidation periods
Session Overlap: Pay attention to multiple session bands converging
Ideal For:
Forex day traders
Session-based trading strategies
Support/resistance identification
Multi-timeframe analysis


Custom ORB (Adjustable Time + Alerts)Opening range Breakout for the current day only. Time frame and be adjusted for first 15 min, 30 min, e.g., 9:30 am to 9:45 am or to 10 am, etc. You can add price alerts for high and low. You can also change the color of solid lines.

Breakout Pro (B:Pro) v4.0Breakout PRO (B:Pro) v4.0 is a multi-filter breakout and trend suite designed for discretionary trading on any symbol and timeframe. It combines a custom EMA cloud, volatility and momentum filters, higher-timeframe trend, and quality scoring into one tool, instead of using multiple separate indicators.
Core concept
The script builds a three-layer EMA cloud around price. The relative position of fast, mid, and slow EMAs plus an ATR padding defines:
Bull regime: stacked EMAs with cloud acting as dynamic support
Bear regime: stacked EMAs with cloud acting as dynamic resistance
Neutral regime: mixed EMAs, cloud fades to neutral color
This cloud defines the main trend and the breakout levels (cloud upper / cloud lower).
A higher-timeframe 200 EMA (configurable timeframe) adds a long-term bias filter.
Support, resistance and structure
Last confirmed swing high and swing low are detected with pivot logic and plotted as dotted support / resistance lines.
These levels are invalidated with a small ATR buffer when price clearly breaks them.
Optional long-term EMA targets (T1 and T2, default 233 and 377) are plotted on the price scale as potential mean-reversion or trend-continuation targets.
Filters used in entries
Long and short breakout signals are only shown when multiple conditions agree. You can enable or disable each filter:
Volume: current volume vs volume SMA
MACD: direction and histogram momentum
RSI: classic OB/OS, with sentiment-adjusted levels
Stoch RSI: direction of K vs D in valid zones
Bollinger Bands + Keltner Channel: squeeze and BB breakouts
VWAP: price relative to VWAP
ADX: trend strength threshold
OBV and Ichimoku: optional extra trend confirmation
A separate Market Sentiment input (Standard, Bullish, Bearish, Consolidation) shifts RSI zones, ADX threshold, and volume requirements so the same logic adapts to different environments.
Signals and exits
The main entry logic:
Long signal: bull EMA stack, breakout above the last pivot resistance and above the upper cloud, plus all enabled long filters are satisfied.
Short signal: mirror conditions below support and below the lower cloud.
Trade state is tracked inside the script:
ATR-based stop level is set on entry using mode-dependent ATR multipliers.
Optional maximum trade duration (different for Short, Mid and Long modes).
Exit markers are plotted when stops are hit, the cloud / EMA stack flips against the trade, MACD or RSI contradict the position, or the time limit is exceeded.
Additional icons mark:
Strong breakouts / breakdowns with large ATR and volume
Squeeze releases after a volatility contraction
EMA cross signals
Continuation and potential reversal zones inside the cloud
Optional RSI divergence arrows based on a separate RSI tuned per trade mode.
Quality and safety scoring
For every entry the script computes:
Safety score (1–3): based mainly on volume, ADX trend strength, and alignment with the cloud regime.
Quality score (1–3): based on BB breakout, MACD and RSI agreement, and whether the signal matches the selected market sentiment.
You can:
Show small S/Q labels next to the entry signal
Use the fixed panel in the bottom-left corner to view the last 5 trade events (opens, closes, crosses) with their S and Q values.
Inputs and layout options
Key inputs:
Trade Mode: Short (e.g. 30 min), Mid (e.g. 4h), Long (e.g. 1D+). Adjusts EMA lengths, ATR settings and the RSI length used for divergences.
Market Sentiment: adjusts filters as described above.
Per-filter toggles for volume, MACD, RSI, Stoch RSI, BB, Ichimoku, ADX, OBV, VWAP, HTF levels.
Panel size: Desktop, Phone, or None for the signal history table.
Side labels: Desktop (full text labels on the price scale) or Phone (compact labels without text) for better compatibility on small screens.
Usage notes
This is a technical analysis tool, not a trading system or financial advice. Signals are calculated on closed data without intentional look-ahead, but values on the current forming bar can still change until the bar closes. Use the script as a structured framework for trend, breakout and confluence analysis, and always confirm signals with your own risk management and testing.

Trading Sessions Highlighter (Extensible) - v6Allows you to create customisable trading sessions besides the usual ones
Tamil - Dynamic Top/Bottom Range with EMATamil – Dynamic Top/Bottom Range with EMA is an all-in-one trend + targets indicator designed for intraday and swing trading. It combines a clean EMA crossover entry signal, automatic take-profit levels, dynamic support/resistance range lines, and a multi-timeframe dashboard to quickly confirm trend strength across multiple timeframes.
What it shows on the chart
• 5 EMAs (14 / 21 / 55 / 100 / 200) with fully customizable colors to visualize short-term vs long-term trend.
• BUY / SELL signals based on EMA14 crossing EMA21:
• Buy Signal: EMA14 crosses above EMA21
• Sell Signal: EMA14 crosses below EMA21
• Auto Take-Profit levels (TP1 / TP2 / TP3) for every new signal:
• TPs are calculated by percentage move from the signal candle close
• Separate TP percentages for Buy and Sell
• Plots dashed TP lines and prints labels with exact price levels
• Includes alerts for Buy/Sell + each TP hit
• Dynamic Range Lines
• Plots rolling Resistance (highest high) and Support (lowest low) using a configurable lookback
Multi-Timeframe Dashboard (Table)
A compact table shows key confirmation signals across:
1m, 5m, 15m, 1H, 4H, 1D, 1W
• RSI value
• Stochastic value
• Supertrend direction (Buy/Sell/Neutral)
• SMA trend bias (Buy/Sell/Neutral)
with heat-map style coloring for faster reading.
Alerts Included
• Buy Signal / Sell Signal
• TP1 / TP2 / TP3 reached (Buy & Sell)
Note: This is an indicator (not a strategy/backtest). Use proper risk management and confirm signals with your own trade plan.

Tamil - BOS/CHOCH Demand & SupplyTamil – BOS/CHOCH Demand & Supply is a Smart Money Concepts (SMC) indicator that automatically detects Break of Structure (BOS) and Change of Character (CHOCH) events and draws clean Demand (bullish) and Supply (bearish) zones directly on the chart.
It supports multiple pivot lookback periods at the same time (ex: 1,2,3,5,11,15,20) to map structure from micro to higher swings, and it keeps zones updated as price interacts with them.
What it does
• Creates Demand zones (green) when price confirms a bullish break above a prior swing high (BOS/CHOCH).
• Creates Supply zones (red) when price confirms a bearish break below a prior swing low (BOS/CHOCH).
• Labels each zone as “BOS Demand/Supply” or “CHOCH Demand/Supply” and includes the lookback period used to form it.
Zone lifecycle (auto-managed)
• Active zone: drawn and extended forward until invalidated.
• Mitigation: when price revisits the zone (first touch), the zone turns gray to mark it as mitigated.
• Break / invalidation: if price fully breaks the zone (below demand bottom / above supply top), the zone is deleted.
Optional “Inducement / Liquidity Grab” filter (IDM)
If enabled, zones are only drawn when the swing that created the break also swept liquidity from the previous swing (a common SMC “inducement” condition), helping focus on higher-probability zones.
Alerts included
• New confirmed Demand zone
• New confirmed Supply zone
• Zone Mitigated
• Zone Broken
Notes
This is an indicator for structure + zone mapping (not a backtest strategy). Use proper risk management and confirm zones with your own execution rules.

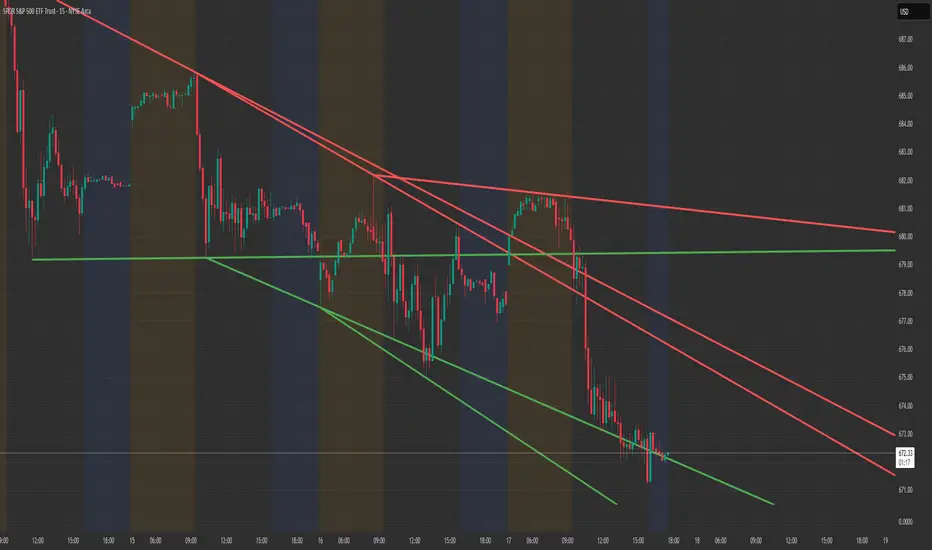
Structure Lite - Automatic Major Trend LinesStructure Lite — Automatic Major Trend Lines
Structure Lite automatically detects and plots major market structure using higher-timeframe pivot highs and lows.
It is designed to provide a clean, lightweight view of primary support and resistance without manual drawing or chart clutter.
This script focuses only on major structure and intentionally excludes short-term noise, advanced liquidity concepts, or signal logic.
Features
Automatically plots major resistance (red) and major support (green) trend lines
Uses higher-period pivots to reflect macro / swing structure
Lines extend right for forward projection
Keeps only the most recent major levels to reduce clutter
Optional toggle to hide all trend lines for a clean chart view
How to Use
Add the indicator to your chart
Adjust Major Pivot Period to control how swing-based the structure is
Higher values = fewer, more important levels
Lower values = more responsive structure
Use the plotted lines to:
Identify higher-timeframe support and resistance
Contextualize price action and trend bias
Toggle Hide All Trend Lines to quickly remove structure without removing the indicator
This tool is intended for context and structure awareness, not trade signals.
Design Philosophy
Structure Lite is intentionally minimal:
No alerts
No buy/sell signals
No predictions
No performance claims
It is built as a foundational structure tool that can be combined with the user’s own methodology.
Notes
Some inputs reference advanced features available in a separate professional version
These options are disabled here and included only for interface consistency
No external links, promotions, or monetization are included in this script
Disclaimer
Educational and informational purposes only.
This script does not provide financial advice or trade recommendations.
Past market behavior does not guarantee future results.
© 2025 GammaBulldog
Custom 4 SMAsCustom 4 SMAs – Fully Customizable Moving Averages
This indicator allows you to plot up to four independent Simple Moving Averages (SMAs) on your chart, with complete control over each one.
Features:
• Individually enable or disable each SMA
• Set custom length for each SMA
• Choose any color
• Adjust line width (1–4)
• Select line style: Solid, Dashed, or Dotted
Perfect for:
- Multi-timeframe trend analysis
- Golden/death cross setups
- Support & resistance visualization
- Clean chart overlays without clutter
Default lengths are set to popular values (20, 50, 100, 200), but you can easily adjust them to fit your strategy (e.g., 9/21/55/200 or any other combination).
Lightweight, clean, and highly customizable — ideal for traders who want multiple SMAs without adding separate indicators for each.
