Triple VWAP: Anchored# Triple VWAP: Anchored + Last 2 Sessions
## 📊 Overview
**Triple VWAP** is a professional-grade Volume Weighted Average Price (VWAP) indicator designed for serious traders who need multi-timeframe volume analysis on a single chart. This indicator combines three powerful VWAP calculations: a custom **Anchored VWAP** from any historical date, a real-time **Current Session VWAP**, and **Previous Session VWAP** reference levels—all with configurable standard deviation bands.
Perfect for intraday traders, swing traders, and institutional-level analysis on Indian markets (Nifty, BankNifty) and global instruments.
***
## ✨ Key Features
### 🎯 Three Independent VWAP Calculations
**📍 Anchored VWAP (Long-term Reference)**
- Anchor VWAP from any specific date and time (year, month, day, hour, minute)
- Ideal for tracking price action from significant market events, earnings, or trend reversals
- Maintains accumulation from your chosen anchor point throughout the entire timeframe
**📅 Current Session VWAP (Real-Time)**
- Automatically resets at the start of each trading day
- Calculates dynamically as new bars form during the session
- Shows institutional trading levels and intraday fair value
**📆 Previous Session VWAP (Reference Levels)**
- Displays yesterday's final VWAP as horizontal reference lines
- Helps identify support/resistance zones from prior session
- Useful for gap analysis and opening range strategies
### 📐 Standard Deviation Bands
Each VWAP calculation includes optional standard deviation bands:
- **±1 SD** - Identifies normal price deviation zones
- **±2 SD** - Marks extreme price movements (high probability reversal zones)
- **±3 SD** - Ultra-extreme levels (rare price extensions)
Configure which SD levels to display for each VWAP type independently.
### 🎨 Customizable Visual Settings
- **Independent Color Schemes**: Assign unique colors to each VWAP type and its SD bands
- **Adjustable Line Widths**: Configure VWAP and SD line thickness (1-5 for VWAP, 1-3 for SD)
- **Plot Styles**: Previous session plots use cross-style for clear differentiation from real-time plots
- **Background Zones**: Optional colored zones when price extends beyond ±2 SD levels
- **Session Labels**: Automatic date labels marking each VWAP anchor point
### 📊 Information Dashboard
Real-time statistics table displaying:
- Current VWAP values for all three calculations
- Live standard deviation values
- ±1 SD levels for quick reference
- Distance from price to each VWAP (percentage format)
- Session tracking counter
- Color-coded proximity indicators
***
## 🔧 How to Use
### For Intraday Trading
1. **Current Session VWAP** acts as dynamic support/resistance—price above VWAP indicates bullish bias, below indicates bearish bias
2. Use **±1 SD bands** for profit targets and stop-loss placement
3. **±2 SD touches** often signal mean reversion opportunities
4. **Previous Session VWAP** provides overnight gap reference levels
### For Swing Trading
1. **Anchored VWAP** from significant events (breakouts, earnings, trend changes) shows institutional cost basis
2. Price trading consistently above/below anchored VWAP confirms trend strength
3. SD band rejections provide high-probability entry zones
### For Multi-Timeframe Analysis
1. Combine all three VWAPs to identify confluence zones
2. When current session VWAP aligns with previous session and anchored VWAP, expect strong support/resistance
3. Monitor distance percentage to gauge overextension
***
## ⚙️ Input Parameters
**📍 Anchored VWAP Configuration**
- `Enable Anchored VWAP` - Toggle on/off
- `Year, Month, Day, Hour, Minute` - Set your custom anchor point (requires confirmation)
**📅 Session VWAP Toggles**
- `Enable Current Session VWAP` - Toggle real-time daily VWAP
- `Enable Previous Session VWAP` - Toggle yesterday's reference VWAP
**General Settings**
- `VWAP Source` - Choose calculation source (default: HLC3)
- `Show ±1/2/3 SD` - Enable/disable each standard deviation level
**Visual Customization**
- Individual color pickers for each VWAP type and SD bands
- Line width adjustments
- `Show VWAP Labels` - Date labels at anchor points
- `Show Info Table` - Statistics dashboard toggle
- `Show SD Zones` - Background coloring beyond ±2 SD
***
## 💡 Trading Applications
✅ **Mean Reversion Trades**: Enter when price touches ±2 SD with reversal confirmation
✅ **Trend Following**: Trade in direction when price holds above/below VWAP
✅ **Institutional Levels**: Anchored VWAP reveals where large players accumulated positions
✅ **Gap Trading**: Use previous session VWAP to gauge gap fill probability
✅ **Volume Profile Analysis**: VWAP represents fair value based on actual volume traded
✅ **Support/Resistance Confluence**: Multiple VWAP alignment creates high-probability zones
***
## 🎓 Understanding VWAP
VWAP is the average price weighted by volume—representing the true average price paid by all market participants during a specific period. Unlike simple moving averages, VWAP gives more weight to price levels with higher trading volume, making it particularly valuable for:
- Institutional traders executing large orders
- Algorithmic trading systems
- Identifying fair value and overextended prices
- Minimizing market impact on large trades
***
## 📈 Chart Setup Recommendations
**Best Timeframes**: 1-minute to 15-minute charts for intraday; 1-hour to 4-hour for swing trading
**Compatible Markets**: Stocks, Indices (Nifty 50, Bank Nifty), Futures, Forex, Crypto
**Session Settings**: Works with standard daily sessions; automatically detects trading days (not calendar days)
***
## 🚀 What Makes This Indicator Unique
Unlike standard VWAP indicators that only show current session data, **Triple VWAP** provides:
- **Multi-session analysis** on a single chart without clutter
- **Historical anchoring** capability for event-driven analysis
- **Professional-grade statistics** dashboard
- **Independent customization** for each VWAP type
- **Optimized calculations** for real-time performance
***
## ⚠️ Important Notes
- **Anchored VWAP** requires manual date input (use significant market events like breakouts, earnings, trend reversals)
- **Session detection** based on daily timeframe changes—works on all chart timeframes
- **Previous Session VWAP** displays as static horizontal lines (reference only, not recalculated)
- **Standard Deviations** calculated using volume-weighted variance formula
- Works best on instruments with **consistent volume data**
***
## 📝 Credits & License
This indicator is published under **TradingView House Rules**. Code is original and follows Pine Script v6 best practices for performance and maintainability.
***
## 🤝 Support & Feedback
If you find this indicator valuable, please:
- ⭐ **Like** this publication
- 💬 **Comment** with your feedback or questions
- 🔔 **Follow** for updates and new releases
***
**Disclaimer**: This indicator is for educational and informational purposes only. Past performance does not guarantee future results. Always use proper risk management and combine with your own analysis before making trading decisions.
***
Полосы и каналы

IED [Harmonic Volatility Edition]IED-H
IED-H (Harmonic Volatility Edition) is a professional mean-reversion and exhaustion detection engine designed to identify institutional stress zones, volatility extremes, and harmonic reversals using a geometry-based statistical framework.
This indicator does not chase trends or breakouts.
Instead, it focuses on detecting when price deviates excessively from its equilibrium and begins to lose efficiency.
⸻
🔬 Core Concept
IED-H measures price deviation from a dynamic trend baseline and projects it into harmonic volatility bands derived from natural square-root ratios:
• √2 → Pulse (normal deviation)
• √3 → Stretch (institutional stress)
• √5 → Extreme (critical exhaustion)
These levels adapt dynamically to market volatility and are not fixed thresholds.
⸻
⚙️ Key Features
• Harmonic Volatility Geometry
Dynamic √2 / √3 / √5 bands scaled by statistical volatility.
• Responsive Wave Engine
Smoothed deviation wave (HMA / RMA modes) for early exhaustion detection.
• Equilibrium Noise Filter
Automatically ignores weak, low-energy oscillations around balance.
• Persistence Logic
Requires prior presence inside overbought/oversold zones to avoid false signals.
• Candle Validation
Signals are confirmed using wick structure and true volatility (ATR-based).
• Harmonic Score (Debug Mode)
Quantifies how deeply price penetrates harmonic stress levels.
• Institutional Visualization
Optional on-chart boxes highlighting validated harmonic reaction zones.
⸻
🎯 What This Indicator Is Designed For
✔ Mean-reversion trades
✔ Exhaustion & volatility climax detection
✔ Trap zones and institutional reaction areas
✔ Advanced traders who value signal quality over signal quantity
⸻
🚫 What This Indicator Is NOT
✘ Not a trend-following system
✘ Not a breakout indicator
✘ Not designed for momentum chasing
✘ Not a multi-purpose “all-in-one” tool
IED-H is a precision instrument, not a Swiss-army knife.
⸻
🧠 Best Practice
For optimal results, use IED-H within a broader trading framework, preferably alongside:
• Higher-timeframe trend context
• Market structure or session logic
• Risk-controlled execution rules
⸻
⚠️ Disclaimer
This indicator is for educational and analytical purposes only.
It does not constitute financial advice.
Always manage risk and test thoroughly before live trading.

Supply & Demand - Trading Vidhyalaya (Free)A powerful script that automatically plots Supply and Demand zones on your chart. Designed to help traders identify potential reversal areas with precision.
Free Version Capabilities:
Works exclusively on the Daily (1D) Timeframe.
Includes Wick & Strong validation logic.
📍 Pinpoint accurate reversals.
🔔 Real-time alerts for Daily zones.
📉 "Touched" zone logic to keep your chart clean.
Want to use this on Intraday Charts? The Premium version supports ALL Timeframes (1m to Monthly) and includes Multi-Timeframe (MTF) overlay capabilities.

TRV & nTRV - Trimmed Range VolatilityGrid bots require stable volatility measurement - ATR becomes misleading when gaps and sudden spikes distort the average. TRV (Trimmed Range Volatility) is an advanced version of ATR: it filters outliers at the extremes (highest and lowest ranges) and remains unaffected by gaps. This provides real-time, accurate volatility measurement for grid bot setup.Grid bots require stable volatility measurement - ATR becomes misleading when gaps and sudden spikes distort the average. TRV (Trimmed Range Volatility) is an advanced version of ATR: it filters outliers at the extremes (highest and lowest ranges) and remains unaffected by gaps. This provides real-time, accurate volatility measurement for grid bot setup.
Why We Developed TRV?
When a gap or sudden spike occurs in the morning, this extreme movement affects standard ATR calculations for an extended period. Even if the price moves sideways for the rest of the day, ATR remains elevated. This causes grid bots to operate with unnecessarily wide spacing and execute fewer trades.
TRV Advantages:
✅ Unaffected by Gaps: Opening gaps don't distort the calculation
✅ Extreme Point Elimination: Filters the largest and smallest outlier candles
✅ Real-Time Accuracy: Shows current market volatility
✅ Grid Bot Optimization: Enables tighter and more efficient grid spacing
✅ Comparison Capability: Compare different stocks and timeframes with nTRV
Grid Bot Usage:
The TRV value is used directly to calculate the number of grid lines:
(Resistance - Support) / TRV = Number of Grid Lines
Example:
Resistance: $110
Support: $90
TRV: $2
Grid Count: (110-90)/2 = 10 grid lines
Features:
Two Filtering Modes: Manual (enter number) or Percentage-Based (automatic ratio)
Four Indicators in One: nTRV, TRV, ATR, and nATR all displayed on the same panel
nTRV: Normalized value (percentage-based, for stock comparison)
TRV: Absolute value (currency-based, for grid calculation)
ATR & nATR Included: Standard ATR and nATR for direct comparison with TRV
Comprehensive Analysis: Compare filtered (TRV) vs unfiltered (ATR) volatility side-by-side
Default: 10% top, 10% bottom outlier elimination
Conclusion:
TRV is an advanced version of ATR specifically designed for grid bot traders. By filtering outlier movements, it provides more stable and reliable volatility measurement. The indicator includes both TRV (filtered) and ATR (unfiltered) on the same chart, giving traders a comprehensive view to make informed decisions. This dual-display approach enables more efficient grid strategies and increased trading frequency.

_Mean_RAWAn indicator based on the “ mean reversion ” strategy.
Works best with the EURUSD 4h pair. Different time frames can be used for other pairs.
The pyramiding feature does not make significant changes; it is not an important parameter.
It definitely does not repaint, especially if you trade on candle closes using the per bar close type alarm.
Green label -> 🟢 buy
Red label -> 🔴 sell
Yellow label -> 🟡 close
Your suggestions regarding the indicator are important to me.

VWMA CloudA volume-weighted moving average (VWMA) cloud consisting of fast and slow VWMAs. The lines are dynamically colored based on their relative positions, forming a visual cloud that highlights bullish and bearish trends.
A normal moving average (SMA or EMA) weights prices equally (or by recency) and ignores volume, so it reacts the same regardless of how much trading occurred. A volume-weighted moving average (VWMA) weights each price by its trading volume, so high-volume moves shift the average more and low-volume moves shift it less. This makes VWMA more representative of where the market is actually trading and filters out weak, low-participation moves.

Supfabio Break-Return BandsSupfabio Break-Return Bands (B3 & B4 • 3-Candle Confirmation)
Supfabio Break-Return Bands is a volatility-based price action indicator built on top of a Two-Pole smoothing filter combined with ATR-derived dynamic bands.
It is designed to highlight price exhaustion, rejection, and potential reversal zones, with a strong emphasis on structural confirmation rather than immediate breakouts.
Core Concept
The indicator plots four volatility bands (Band 1 to Band 4) above and below a smoothed Two-Pole filter.
Signals are intentionally restricted to the outer bands, where price behavior is statistically more likely to show:
Volatility expansion
Liquidity grabs (stop runs / false breaks)
Strong rejection or mean-reversion behavior
Signal Logic
Band 4 (Primary Extreme Zone)
BUY and SELL signals are generated when:
Initial trigger (first candle)
Price either crosses the Band 4 level or
Touches and rejects the band (wick / pin behavior)
Confirmation on the 3rd candle (t + 2)
The confirmation candle:
Must not touch the same band again
Must close on the correct side of the band
Confirms that the initial break or pin was rejected
This delayed confirmation helps filter false breakouts and impulsive entries.
Band 3 (Secondary Setup)
On Band 3, signals are intentionally more selective:
Pin / rejection only
No direct cross signals
Uses the same 3-candle confirmation logic
This allows Band 3 signals to act as deeper pullback or early exhaustion setups.
Confirmation Mechanism
The script uses an internal state-based logic to:
Track the exact bar where the trigger occurred
Confirm signals only on the correct third candle
Prevent duplicate or consecutive signals from the same setup
Ensure pin-based triggers are not missed
Visual Elements
Main Two-Pole filter plotted as a thick continuous line
Volatility bands plotted with progressive line thickness
Band line styles (dotted / dashed) can be customized manually in the Style tab
Clear BUY and SELL labels plotted directly on the confirmation candle
Optional candle coloring based on filter direction
Alerts & Automation
Built-in alertcondition() for BUY and SELL
Alerts are suitable for webhook automation
Compatible with external systems and trading bots
Intended Use
This indicator is suitable for:
Reversal and exhaustion analysis
Mean-reversion strategies
Liquidity and rejection-based setups
Manual trading or automated execution
Intraday and higher-timeframe analysis
Notes
This script is intended as an analytical tool, not as a standalone trading system.
Signals should be used in combination with market structure, trend context, and proper risk management.

OC Chain_ROC_RSI15-minute indicator that detects a 3-candle “inside” chain where each candle’s open & close remain within the previous candle’s open-close range. Plots horizontal Open/Close levels on candles when ROC(2) moves beyond a configurable ±threshold, and highlights candles when RSI is strong (>55) or weak (< user set level, e.g., 30–32). Adjustable ROC/RSI settings and line extension options.


mama special indcator Below is a faithful English translation, preserving the structure and intent of the original text.
---
# Mom’s Dedicated Indicator – User Manual 📈
## What Does This Indicator Do?
This indicator helps you see **whether the current direction is up or down**, and reminds you when it may be appropriate to buy or sell.
In simple terms:
* When you see a **green “Long”** label → you may consider buying (going long)
* When you see a **red “Short”** label → you may consider selling (going short)
* The top-right corner shows whether the market is currently **Bullish**, **Bearish**, or **Ranging**
---
## What Do the Things on the Screen Mean?
### The Colored Lines (Moving Averages)
| Line Color | Name | Meaning |
| ----------------- | -------------------- | ---------------------------------------------- |
| Lightest blue | Ultra-fast line (13) | Reacts the fastest, but also whipsaws the most |
| Light blue | Fast line (21) | Short-term direction |
| Medium blue | Mid line (55) | Medium-term direction |
| Dark blue (thick) | Slow line (89) | More stable direction |
| Gold (thickest) | Baseline (200) | Major trend, the most important one |
**Simple way to judge:**
* Price **above** the gold line → overall trend is bullish
* Price **below** the gold line → overall trend is bearish
### The Small Box in the Top-Right Corner
* **Current Direction**: Tells you whether the market is bullish, bearish, or ranging
* **Strength**:
* ✓ means the trend is strong enough
* ✗ means the momentum is insufficient
---
## How Should I Adjust the Settings?
In the indicator settings (click the gear ⚙️ next to the indicator name), you will see the following options:
### 1. Crossover Combinations (Sensitivity Selection)
| Option | Number of Signals | Suitable For |
| ------------------------ | ----------------- | --------------------------------------------- |
| Ultra Aggressive (13/21) | Most | Want many alerts, not afraid of false signals |
| Very Aggressive (13/55) | Very many | More active traders |
| Aggressive (13/89) | Many | Want more opportunities |
| Standard Fast (21/55) | Medium-high | Balanced but slightly aggressive |
| **Standard (21/89)** | **Medium** | **Recommended – best balance** |
| Conservative (55/89) | Few | Only want the most reliable signals |
**Mom’s recommendation:** Start with **Standard (21/89)**. Try other options after you are familiar with it.
### 2. Only Signal in the Direction of the Trend
* **On (recommended):** Signals appear only when aligned with the major trend
* **Off:** Signals appear regardless of trend (higher risk)
### 3. Use ADX to Filter Ranging Markets
* **On (recommended):** Shows “Ranging” when the market lacks momentum, avoiding random trades
* **Off:** Signals appear regardless of market strength
### 4. ADX Threshold
* Higher number = stricter requirements
* **Recommended: 20** (default)
* If you feel there are too few signals, lower it to 15
* If you feel there are too many false signals, raise it to 25
### 5. Show Auxiliary Lines
* On: Displays the colored moving average lines
* Off: Cleaner chart, signals only
### 6. Show Direction Indicator
* On: Displays the direction box in the top-right corner
* Off: Does not display it
---
## How Do I Use This Indicator?
### Step 1: Check the Major Trend
Look at the top-right box:
* **Bullish** + strength ✓ → look for buying opportunities
* **Bearish** + strength ✓ → look for selling opportunities
* **Ranging** → **do nothing and wait**
### Step 2: Wait for a Signal
* Green “Long” → you may consider buying
* Red “Short” → you may consider selling
### Step 3: Confirm the Timeframe
* If you see a yellow warning: **“⚠️ Please use 1-hour chart or above”**
* It means your current timeframe is too short (e.g., 5-minute or 15-minute)
* **Switch to 1-hour, 4-hour, or daily charts**
---
## Important Reminders ⚠️
### What This Indicator Does *Not* Tell You:
1. **When to exit** — It only helps with entries; exits are your own decision
2. **How much to buy** — Decide based on your own risk tolerance
3. **Guaranteed profits** — No indicator can guarantee profitability
### Safe Trading Guidelines:
1. **Do not all-in** — Use only a small portion of your capital each time
2. **Set a stop loss** — Decide in advance how much loss you can accept
3. **Do not force trades in ranging markets** — If it says “Ranging,” rest
4. **Do not chase highs or sell lows** — If price has already moved too far, skip it
5. **Use higher timeframes** — 1-hour, 4-hour, or daily charts are more stable
### The Most Important Sentence:
> **“Better to miss a trade than to make a wrong one.”**
>
> When you are not confident, doing nothing is the best choice.
---
## Quick Reference Card
| What I See | What I Should Do |
| -------------------------- | ------------------------------ |
| “Bullish” + ✓ in top-right | Look for buying opportunities |
| “Bearish” + ✓ in top-right | Look for selling opportunities |
| “Ranging” in top-right | Do nothing, wait |
| Green “Long” label | Consider buying |
| Red “Short” label | Consider selling |
| Yellow warning label | Switch to a higher timeframe |
| Strength shows ✗ | Trend is weak, be cautious |
---
## Have Questions?
This indicator was designed specifically for you. If anything is unclear, or if you want to adjust any features, just let me know anytime.
❤️ Wishing Mom smooth investing and steady profits!
媽媽專用指標 使用說明書 📈
這個指標是做什麼的?
這個指標會幫妳看「現在的方向是往上還是往下」,然後在適合的時候提醒妳可以買或賣。
簡單來說:
看到 綠色「多」 的標籤 → 可以考慮買進(做多)
看到 紅色「空」 的標籤 → 可以考慮賣出(做空)
右上角會顯示目前是「看漲」、「看跌」還是「震盪」
畫面上的東西是什麼意思?
那些彩色的線(均線)
線的顏色
名稱
意思
最淺的藍色
超快線 (13)
反應最快,但也最容易亂跳
淺藍色
快線 (21)
短期方向
中藍色
中線 (55)
中期方向
深藍色(粗)
慢線 (89)
比較穩定的方向
金色(最粗)
基準線 (200)
大方向,最重要!
簡單判斷法:
價格在金色線「上面」→ 大方向是漲的
價格在金色線「下面」→ 大方向是跌的
右上角的小框框
目前方向:告訴妳現在是看漲、看跌、還是震盪
強度:後面有 ✓ 表示趨勢夠強,有 ✗ 表示力道不夠
設定選項怎麼調?
在指標設定裡面(點指標名稱旁邊的齒輪 ⚙️),有這些選項:
1. 交叉組合(選擇敏感度)
選項
信號多寡
適合誰
超激進 (13/21)
最多
想要很多提示,不怕假信號
很激進 (13/55)
很多
比較積極的操作
激進 (13/89)
多
想多一點機會
標準偏快 (21/55)
中等偏多
想要平衡但稍微積極
標準 (21/89)
中等
建議用這個,最平衡
保守 (55/89)
少
只想要最可靠的信號
媽媽建議: 先用「標準 (21/89)」就好,等熟悉了再試其他的。
2. 順著方向才給信號
打開(建議):只有大方向對的時候才會提示
關掉:不管方向都會提示(比較危險)
3. 用ADX過濾震盪
打開(建議):市場沒力氣的時候會顯示「震盪」,避免亂買賣
關掉:不管市場有沒有力氣都會給信號
4. ADX門檻
數字越大,要求越嚴格
建議用 20(預設值)
如果覺得信號太少,可以降到 15
如果覺得假信號太多,可以升到 25
5. 顯示輔助線
打開:會看到那些彩色的線
關掉:畫面比較乾淨,只看信號
6. 顯示方向提示
打開:右上角會有小框框顯示方向
關掉:不顯示
怎麼用這個指標?
步驟一:先看大方向
看右上角的框框:
顯示「看漲」+ 強度有 ✓ → 適合找機會買
顯示「看跌」+ 強度有 ✓ → 適合找機會賣
顯示「震盪」→ 先不要動,等待就好
步驟二:等信號出現
看到綠色「多」→ 可以考慮買進
看到紅色「空」→ 可以考慮賣出
步驟三:確認時間週期
畫面上如果出現黃色警告「⚠️ 請用1小時圖或以上」
表示妳現在看的時間太短了(例如5分鐘、15分鐘)
請切換到1小時或4小時或日線圖
重要提醒 ⚠️
這個指標「不會」告訴妳的事情:
什麼時候該出場 — 指標只告訴妳進場時機,出場要自己決定
該買多少 — 請根據自己能承受的風險決定
一定會賺錢 — 沒有任何指標能保證獲利
安全操作建議:
不要all-in — 每次只用一小部分資金
設停損 — 買進之後,決定好「跌到多少就認賠」
震盪時不要硬做 — 右上角顯示震盪就休息
不要追高殺低 — 信號出現後如果價格已經跑很遠,就算了
用大一點的時間週期 — 1小時、4小時、日線比較穩
最重要的一句話:
「寧可錯過,不要做錯」
沒把握的時候,不做就是最好的選擇。
快速參考卡
我看到...
我應該...
右上角「看漲」+ ✓
可以找機會買
右上角「看跌」+ ✓
可以找機會賣
右上角「震盪」
不要動,等待
綠色「多」標籤
可以買進
紅色「空」標籤
可以賣出
黃色警告標籤
換到更大的時間週期
強度後面是 ✗
趨勢不夠強,要小心
如果有問題?
這個指標是專門為妳設計的,如果有看不懂的地方,或是想要調整什麼功能,隨時跟我說!
❤️ 祝媽媽投資順利,穩穩賺錢!

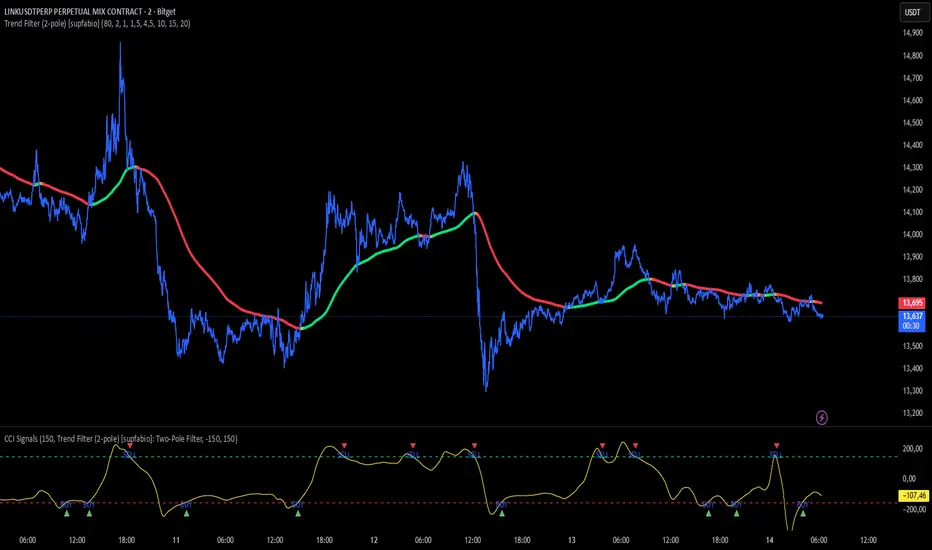
CCI + Buy/Sell Cross (supfabio)This indicator is an enhanced version of the Commodity Channel Index (CCI) designed to generate clear BUY and SELL signals based on customizable level crossovers, with built-in support for webhook automation and external trade execution.
🔹 Signal Logic
BUY Signal:
Triggered when the CCI crosses upward (from below to above) the user-defined BUY level (red line).
SELL Signal:
Triggered when the CCI crosses downward (from above to below) the user-defined SELL level (green line).
Signals can optionally be configured to trigger only on candle close, reducing real-time noise and false signals.
🔹 Key Features
✅ Original CCI calculation (standard formula preserved)
✅ Fully configurable BUY and SELL levels
✅ Optional display of signal level lines
✅ Visual BUY / SELL markers plotted on the CCI panel
✅ Support for moving average smoothing and Bollinger Bands applied to the CCI
✅ Dynamic alerts using alert(), ideal for:
Webhook integrations
Trading bots
External servers and automated execution systems
🔹 Alerts & Webhook Integration
The indicator sends dynamic alert messages containing:
Action type (BUY / SELL)
Symbol
Closing price
Timestamp
To use:
Add the indicator to your chart
Create an alert and select “Any alert() function call”
Enable Webhook URL and configure your endpoint
Done — signals will be sent automatically
🔹 Best Use Cases
Traders who use CCI as a primary entry trigger
Momentum or mean-reversion strategies
Automated trading systems
Visual backtesting and signal validation
⚠️ Disclaimer
This indicator is not a complete trading system and does not replace proper risk management. Always use it in combination with market context, confirmation tools, and sound position sizing.
Stoxway % Erode PX% Erode Indicator
The % Erode Indicator is a proprietary market-efficiency and momentum-decay model developed by StoxWay, designed to quantify the rate at which directional conviction erodes within a price trend. Rather than focusing solely on price direction, the indicator measures trend durability, participation fatigue, and hidden weakening beneath apparent price continuation.
Traditional momentum indicators often respond late to internal degradation. The % Erode framework addresses this gap by expressing trend deterioration as a percentage-based erosion metric, allowing for normalized comparison across instruments, timeframes, and volatility regimes.
Conceptual Framework
Markets rarely reverse without first losing internal strength. Before price visibly changes direction, momentum, follow-through efficiency, and structural continuity begin to decay. The % Erode Indicator is engineered to detect this internal decay early, providing an objective lens into whether a trend is strengthening, stabilizing, or quietly exhausting.
Interpretive Regimes
Low Erosion (% Stable / Strength Phase):
A low and stable % Erode reading indicates sustained trend efficiency, where price progression remains supported by consistent participation and structure. This environment reflects higher trend reliability and reduced probability of premature reversal.
Rising Erosion (% Fatigue Phase):
An increasing % Erode value signals growing internal inefficiency. While price may continue in the prevailing direction, the underlying trend quality is deteriorating. This phase often precedes volatility expansion, false breakouts, or corrective behavior.
High Erosion (% Breakdown Risk Phase):
Elevated erosion readings reflect advanced trend exhaustion, where directional continuation becomes statistically fragile. Such conditions warrant heightened risk awareness, exposure reduction, or tactical repositioning.
Erosion Reset (Post-Correction / Re-Accumulation):
A sharp contraction in erosion following price compression or correction suggests structural reset, often marking the transition into a new accumulation or distribution phase.
Strategic Applications
The % Erode Indicator functions primarily as a risk-timing and trend-quality filter, rather than a directional signal generator. It is particularly effective in:
Identifying late-stage trends despite continued price movement
Filtering false continuation breakouts
Enhancing position-sizing and exit timing
Differentiating healthy pullbacks from structural deterioration
% Erode Indicator – Operational Framework
The % Erode Indicator is designed to be applied in conjunction with a 50-period Exponential Moving Average (50 EMA), which serves as the primary directional and structural reference. The indicator itself focuses on internal strength erosion and recovery dynamics, rather than absolute price direction.
The model operates through a normalized signal-line range, enabling objective interpretation of strength, fatigue, and reversal risk.
Strength and Continuation Zone (−20 to 0)
When the signal line remains above −20, the market is interpreted as being in a high-efficiency strength regime, where price is operating near its optimal participation state.
As long as the signal line oscillates between −20 and 0, the prevailing move is considered structurally intact. Within this range, the indicator suggests maintaining directional alignment rather than prematurely reacting to minor price fluctuations.
A decisive transition below −20 reflects meaningful internal degradation, indicating that the prior strength phase may be concluding. This transition can be used as a contextual trigger to reassess directional bias or evaluate counter-trend positioning, subject to confirmation from the broader framework (including the 50 EMA).
Weakness and Extension Zone (−80 to −100)
When the signal line moves below −80, the indicator classifies the market as being in an advanced weakness or exhaustion regime, where downside efficiency dominates.
While the signal line remains between −80 and −100, bearish conditions are considered structurally persistent, and continuation remains statistically favored within that regime.
A recovery above −80 signals erosion reset and potential structural stabilization, often preceding corrective or reversal behavior. This shift can be used to reassess downside exposure or evaluate opposing directional scenarios.
Role of the 50 EMA
The 50 EMA functions as a trend-validation and regime-alignment filter, ensuring that % Erode readings are interpreted within proper directional context. This integration helps reduce noise, improves structural consistency, and aligns the indicator with institutional trend-following practices.
Educational & Professional Usage Note
The % Erode Indicator is intended as a decision-support and risk-evaluation tool, not as a standalone signal generator. Its effectiveness is maximized when used alongside complementary structure, volatility, and higher-timeframe analysis. Market conditions are dynamic, and indicator behavior may vary across instruments and regimes.
For users seeking a deeper understanding of the indicator’s construction, interpretation, and integration within a professional trading framework, structured training sessions are available directly from the indicator’s author. These sessions focus on practical application, contextual reading, and disciplined risk alignment.

Accuracy Matrix Band PXAccuracy Matrix Band
The Accuracy Matrix Band (AMB) is a proprietary quantitative market-structure indicator developed by StoxWay, designed to evaluate directional price expansion, compression phases, and regime transitions through an integrated band and signal-line framework. The model emphasizes structural confirmation over reactive signals, aligning with disciplined, rule-based decision processes.
The indicator is constructed around adaptive price envelopes combined with an Upper and Lower Signal Line, enabling systematic identification of trend persistence, breakdown risk, and consolidation regimes.
Upside Regime Identification:
Sustained price acceptance above the upper band, accompanied by an orderly ascending sequence, is interpreted as evidence of positive directional momentum and improving trend quality. Such conditions may indicate a transition into an expansionary phase, warranting evaluation of long exposure subject to portfolio constraints and corroborative signals.
Downside Regime Identification:
Price acceptance below the lower band with a consistent descending structure reflects increasing downside pressure and potential trend deterioration. This environment may support short exposure assessment or risk reduction within existing long allocations.
Compression and Range Regimes:
When price action remains contained within the signal framework, the indicator classifies the market as being in a low-directional or equilibrium state. These regimes are typically characterized by volatility contraction and reduced trend reliability, often favoring range-based or market-neutral approaches.
The Accuracy Matrix Band is not intended to function as a standalone forecasting tool. Instead, it serves as a regime-filter and structural confirmation layer within a broader multi-factor decision framework. Its effectiveness is enhanced when integrated with complementary signals such as volatility metrics, liquidity analysis, and higher-timeframe market structure.
As with all quantitative models, the indicator is subject to regime shifts, parameter sensitivity, and changing market dynamics. Robust risk management, continuous monitoring, and adaptive recalibration remain integral to its practical deployment.

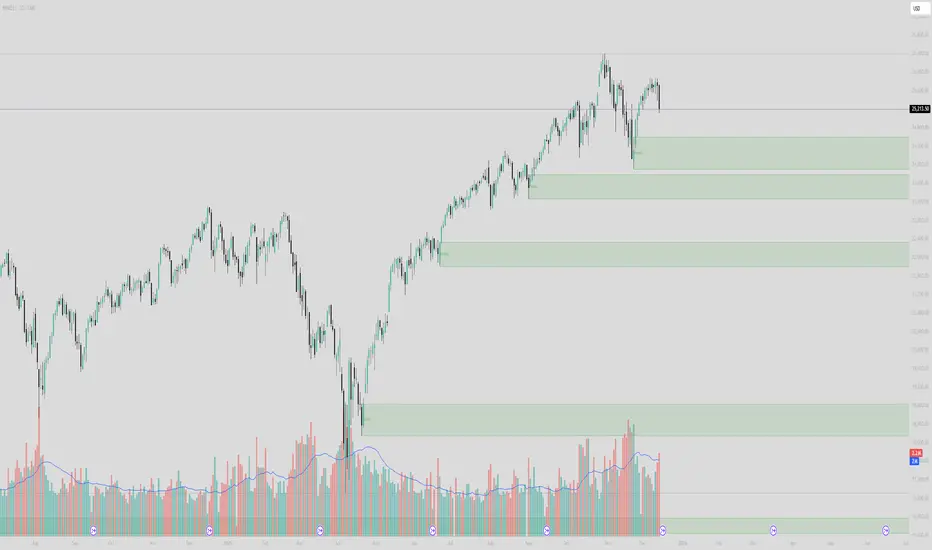
Institutional Supply/Demand (Unmitigated)Title: Institutional Supply/Demand (Unmitigated)
What it does: This indicator automatically detects and highlights Fresh Institutional Supply and Demand Zones based on market structure (Swing Highs and Swing Lows). It is designed to keep your chart clean by only showing levels that have not yet been tested.
Key Features:
Auto-Detection:
Red Boxes (Supply): Appear at major Swing Highs. These represent potential Sell Limit orders from institutions.
Green Boxes (Demand): Appear at major Swing Lows. These represent potential Buy Limit orders.
Mitigation Logic (The "Clean-Up"):
The script actively monitors price action.
If price touches a box, the box is instantly deleted.
This ensures you are never looking at "old" or "used" levels. If a box is visible on your chart, it means price has never returned to that level since it was created.
Customizable Structure:
Structure Lookback: Adjusts how sensitive the detection is.
Setting 5 (Default): Finds major, significant structure points.
Setting 3: Finds smaller, internal structure points (more zones).
How to Trade:
Wait for Price to Return: Watch for price to approach a visible Red or Green box.
Reaction: Since these are "Fresh" levels, look for a rejection (wick) or a reversal pattern as soon as price taps the zone.
No Clutter: You don't need to manually delete old lines; the script does it for you.
Victor aimstar future strategyThis script "The Next Pivot" uses various similarity measures to compare historical price sequences to the current price sequence!
Features
Find the most similar price sequence up to 100 bars from the current bar
Forecast price path up to 250 bars
Forecast ZigZag up to 250 bars
Spearmen
Pearson
Absolute Difference
Cosine Similarity
Mean Squared Error
Kendall
Forecasted linear regression channel

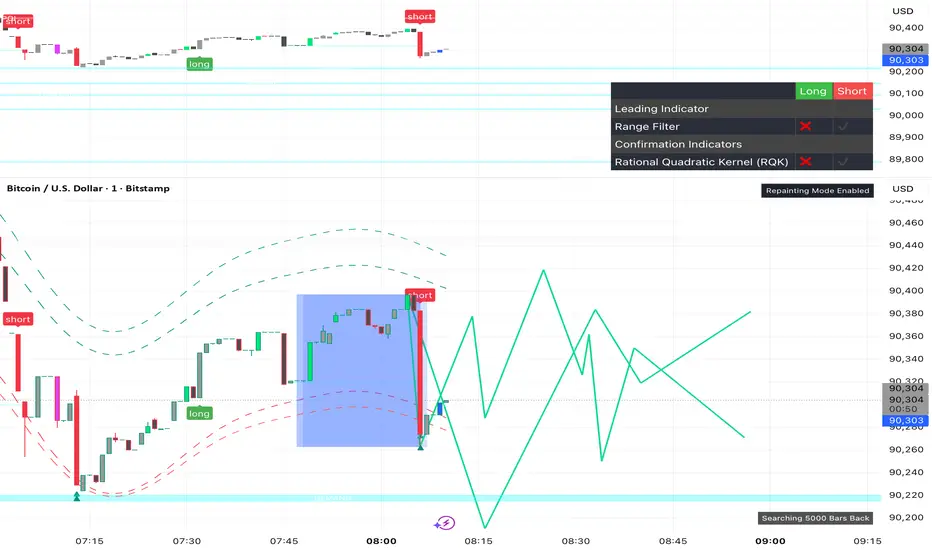
Victor aimstar Present strategyHere we have created an envelope indicator based on Kernel Smoothing with integrated alerts from crosses between the price and envelope extremities. Unlike the Nadaraya-Watson estimator, this indicator follows a contrarian methodology.
Please note that by default this indicator can be subject to repainting. Users can use a non-repainting smoothing method available from the settings. The triangle labels are designed so that the indicator remains useful in real-time applications.

$$\text{Entry and Exit Signals (RSI, MACD, Stochastic)}$$بالتأكيد. إليك شرح كامل للكود البرمجي (Pine Script) الذي يمثل استراتيجية مؤشر الزخم الثلاثي (RSI, MACD, Stochastic) باللغة الإنجليزية، مع توضيح منطق كل شرط:
-----
## 🇺🇸 Multi-Indicator Momentum Confirmation Strategy (Pine Script Explanation)
This custom indicator is designed to generate highly confirmed **Entry (Buy)** and **Exit (Sell/Short)** signals by ensuring that three key momentum and oscillator indicators—**RSI, MACD, and Stochastic**—are all aligned in the same direction.
### 📜 Indicator Code Structure
```pinescript
//@version=5
indicator("إشارات الدخول والخروج (RSI, MACD, Stochastic)", overlay=true)
// --- 1. Indicator Settings (Inputs) ---
rsiLength = input.int(14, title="RSI Length")
rsiLevel = input.float(50, title="Positive RSI Level")
// ... MACD and Stochastic inputs
// --- 2. Calculation of Indicators ---
rsiValue = ta.rsi(close, rsiLength)
= ta.macd(close, fastLength, slowLength, signalLength)
stochK = ta.stoch(close, high, low, stochKLength)
// --- 3. Entry (Bullish) and Exit (Bearish) Conditions ---
//
// --- 4. Final Signal Determination ---
finalEntrySignal = rsiCondition_Bullish and macdCondition_Bullish and stochCondition_Bullish
finalExitSignal = rsiCondition_Bearish and macdCondition_Bearish and stochCondition_Bearish
// --- 5. Plotting the Signals ---
plotshape(
finalEntrySignal ? low : na,
style=shape.labelup,
location=location.belowbar,
text="دخول", // 'Entry'
// ... color and size settings
)
plotshape(
finalExitSignal ? high : na,
style=shape.labeldown,
location=location.abovebar,
text="خروج", // 'Exit'
// ... color and size settings
)
```
### 🧠 Logic Behind the Entry Signal ("دخول" - Buy)
A **"Entry" (Buy)** signal is generated when **ALL THREE** of the following bullish conditions are met on the same candlestick:
| Indicator | Bullish Condition (The Logic) | Why this ensures strong momentum? |
| :--- | :--- | :--- |
| **Relative Strength Index (RSI)** | **Positive AND Increasing:** (`rsiValue > 50`) AND (`rsiValue > rsiValue `) | The asset is not only gaining strength (above the 50 centerline) but its strength is actively **accelerating** (current value is higher than the previous one). |
| **Moving Average Convergence Divergence (MACD)** | **Bullish Crossover:** `macdLine > signalLine` | This indicates that the shorter-term momentum (MACD Line) has crossed above the longer-term momentum average (Signal Line), confirming a potential shift to bullish momentum. |
| **Stochastic Oscillator** | **Positive:** `stochK > 50` | The closing price is in the upper half of the recent price range, suggesting that buying pressure is dominating the current trend cycle. |
**The `finalEntrySignal` is triggered only when `RSI_Bullish AND MACD_Bullish AND Stochastic_Bullish` are true.**
-----
### 📉 Logic Behind the Exit Signal ("خروج" - Sell/Short)
A **"Exit" (Sell/Short)** signal is generated when **ALL THREE** of the following bearish conditions are met on the same candlestick:
| Indicator | Bearish Condition (The Logic) | Why this ensures strong momentum loss? |
| :--- | :--- | :--- |
| **Relative Strength Index (RSI)** | **Negative AND Decreasing:** (`rsiValue < 50`) AND (`rsiValue < rsiValue `) | The asset is losing strength (below the 50 centerline) and its weakness is actively **accelerating** (current value is lower than the previous one). |
| **Moving Average Convergence Divergence (MACD)** | **Bearish Crossover:** `macdLine < signalLine` | The shorter-term momentum has crossed below the Signal Line, confirming a potential shift to bearish momentum. |
| **Stochastic Oscillator** | **Negative:** `stochK < 50` | The closing price is in the lower half of the recent price range, suggesting that selling pressure is dominating the current trend cycle. |
**The `finalExitSignal` is triggered only when `RSI_Bearish AND MACD_Bearish AND Stochastic_Bearish` are true.**
### 💡 Visual Output
* **Entry Signal:** Plotted as a green label with the text "دخول" (**Entry**) **below the bar** (`location.belowbar`).
* **Exit Signal:** Plotted as a red label with the text "خروج" (**Exit**) **above the bar** (`location.abovebar`).
This strategy aims to filter out weak signals by requiring a high level of consensus across multiple technical dimensions.

AJ Super Blast SignalsPrice action trading script suited for all TF, it will work on all instruments NIFTY/ BANK NIFTY/COMMODITY/SENSEX/ MIDCAP NIIFTY AND CRYPTOCURRENCY....IT HELPS TO AVOID SIDEWAYS MARKET SIGNALS WHICH PREVIOUS SCRIPTS DOESNT DO

Fibonacci Fibonacci automatic drawing - Last 144 barFibonacci automatic drawing:
It automatically plots Fibonacci based on the last 144 bars.
According to the drawing rules, it calculates itself from bottom to top and from top to bottom.
This will answer the most challenging questions about drawing the right thing.
If 144 bar is not reached, it draws using manual input.
This will be a useful and practical perspective.
This is for those who want to see the most valuable Fibonacci values on a chart.

O.R.B. New York (Opening Range)- Creates open range at New York Open (9:30am - 9:45am)
- Only shows most recent opening range for New York session (prevents clutter)
- Asset Classes: Micro Gold, Micro Silver, Micro ES, Micro NQ.

Smart Chart Patterns: Breakout Boxes## Abstract
This script is an algorithmic pattern recognition tool designed to identify, validate, and trade classical reversal structures (Double/Triple Tops and Bottoms). Unlike subjective drawing tools, this indicator employs a quantitative approach to geometry. It utilizes Volatility Normalization to ensure that angle detection works consistently across all asset classes—from high-priced assets like Bitcoin to low-volatility Forex pairs—without requiring manual recalibration.
## Methodology & Features
1. Pivot Chaining & Integrity Checks The algorithm identifies Swing Highs and Swing Lows (Pivots). It then "chains" them together to form resistance or support barriers.
Integrity Check: The script strictly enforces that price action between pivots must not violate the connecting line. If price cuts through the line, the pattern is invalidated immediately.
2. Angled vs. Horizontal Structures
Angled Mode: Allows for "channel-like" tops and bottoms (e.g., Rising Wedges or Descending Channels) up to a user-defined volatility-adjusted angle.
Horizontal Mode: If angled lines are disabled, the script applies a strict 1-degree tolerance filter, identifying only classical "Flat" Double/Triple patterns.
3. Trend Filtering To reduce false positives in ranging markets, the script includes a directional filter:
Double Tops are only validated if preceded by a quantitative Uptrend.
Double Bottoms are only validated if preceded by a quantitative Downtrend.
Trend Strength is measured by the net price displacement relative to ATR over a lookback period.
4. Automated Risk Management Upon pattern confirmation (breakout), the script automatically projects:
Target (Green): Projected based on the vertical height of the pattern (Pivot to Neckline).
Stop Loss (Red): Calculated dynamically using the Neckline ± (1.5 * ATR), adapting to current market volatility.
## Settings Guide
Min Touches: Set to 2 for Double patterns, 3 for Triple patterns.
Trend Filter: Enable to ensure the pattern is reversing an existing trend.
Angle Control: Adjusts the maximum allowed slope. Because this is normalized, 15.0 is a robust default for almost all assets.
Targets & Stops: Toggles the automated SL/TP lines and adjusts their multipliers.

Kairos QX Indicator [v1.7]What’s New in v1.7?
Streak Analytics (Dashboard Expansion):
The dashboard now tracks Winning and Losing Streaks.
Max Consec. (TP / SL): Displays the highest number of wins and losses that occurred in a row (e.g., 5 / 3).
Avg Consec. (TP / SL): Calculates the average length of your winning and losing streaks (e.g., 2.4 / 1.8).
Updated Default "settings" for MNQ 5 MIN Candles
Full Script Description
This script is a professional-grade Mean Reversion & Trend Following Engine designed for automated execution. It acts as a bridge between discretionary chart analysis and algorithmic trading, allowing you to backtest complex ideas visually and then automate them via alerts without writing code.
1. Core Logic: The "Flip Switch" Strategy
Standard Mode (Mean Reversion):
The script identifies "exhaustion" points where price pierces the Bollinger Bands.
It bets on a reversal (e.g., Price > Upper Band = Short).
Inverse Mode (Trend Following - Default):
With the "Inverse Trades" box checked, the logic flips.
It identifies "breakout" points where price pierces the bands.
It bets on continuation (e.g., Price > Upper Band = Long).
2. Advanced Automation & Safety Features
This system is built to drive trading bots (like TradersPost or 3Commas) safely:
State-Aware Execution: It tracks its own trades (in_trade state). It will never fire a duplicate "Open" signal if a trade is already active, preventing accidental pyramiding.
No Trade Zone (Force Close): You can define a specific time window (default 15:10–17:00). If a trade is open when this time hits, the script immediately triggers a Close Alert, preventing overnight holds.
Signal Cooldown: Configurable "Signals to Skip" allows you to force a cooldown period after a trade closes to avoid over-trading in choppy conditions.
3. Real-Time Analytics Dashboard
The on-chart table provides a transparent, real-time backtest of your settings:
Equity Calculator: You can set a dollar value per point (e.g., $2 for MNQ). The dashboard calculates your estimated Net Profit/Loss based on the total points gained.
Streak Analysis: Shows both the Maximum and Average number of consecutive wins and losses, helping you understand the psychological difficulty of trading the strategy.
Data Integrity: It automatically detects "N/A" trades (candles that hit both SL and TP) and excludes them from the Win Rate calculation to ensure realistic statistics.
4. Modular "Recipe" Building
The strategy is highly customizable via the settings menu (no coding required). You can filter the Bollinger Band trigger with 10 different indicators:
Supported Filters: RSI, Stochastic, CCI, Williams %R, MFI, CMO, Fisher Transform, Ultimate Oscillator, and ROC.
Logic: All selected filters must agree with the main trigger for a trade to fire.
5. Visual Projection Engine
Glowing Outcomes: The script draws exact TP (Green) and SL (Red) boxes for past trades. These boxes glow to indicate the result, allowing for rapid visual verification of the strategy's performance.
Force Close Markers: Special gray markers appear on the chart where a trade was forced to close due to the "No Trade Zone" time limit.
