Naive Bayes Candlestick Pattern Classifier v1.1 BETAAn intermezzo on why i made this script publication..
A : Candlestick Pattern took hours to backtest, why not using Machine Learning techniques?
B : Machine Learning, no that's gonna be really heavy bro!
A : Not really, because we use Naive Bayes.
B : The simplest, yet powerful machine learning algorithm to separate (a.k.a classify) multivariate data.
----------------------------------------------------------------------------------------------------------------------
Hello, everyone!
After deep research in extracting meaningful information from the market, I ended up building this powerful machine learning indicator based on the evolution of Bayesian Statistics. This indicator not only leverages the simplicity of Naive Bayes but also extends its application to candlestick pattern analysis, making it an invaluable tool for traders who are looking to enhance their technical analysis without spending countless hours manually backtesting each pattern on each market!.
What most interesting part is actually after learning all of likely useless methods like fibonacci, supply and demand, volume profile, etc. We always ended up back to basic like support and resistance and candlestick patterns, but with a slight twist on strategy algorithm design and statistical approach. Thus, the only reason why i made this, because i exactly know that you guys will ended up in this position as time goes by.
The essence of this indicator lies in its ability to automate the recognition and statistical evaluation of various candlestick patterns. Traditionally, traders have relied on visual inspection and manual backtesting to determine the effectiveness of patterns like Bullish Engulfing, Bearish Engulfing, Harami variations, Hammer formations, and even more complex multi-candle patterns such as Three White Soldiers, Three Black Crows, Dark Cloud Cover, and Piercing Pattern. However, these conventional methods are both time-consuming and prone to subjective bias.
To address these challenges, I employed Naive Bayes—a probabilistic classifier that, despite its simplicity, offers robust performance in various domains. Naive Bayes assumes that each feature is independent of the others given the class label, which, although a strong assumption, works remarkably well in practice, especially when the dataset is large like market data and the feature space is high-dimensional. In our case, each candlestick pattern acts as a feature that can be statistically evaluated based on its historical performance. The indicator calculates a probability that a given pattern will lead to a price reversal, by comparing the pattern’s close price to the highest or lowest price achieved in a lookahead window.
One of the standout features of this script is its flexibility. Each candlestick pattern is not only coded into the system but also comes with individual toggles to enable or disable them based on your trading strategy. This means you can choose to focus on single-candle patterns like Bullish Engulfing or more complex multi-candle formations such as Three White Soldiers, without modifying the core code. The built-in customization options allow you to adjust colors and labels for each pattern, giving you the freedom to tailor the visual output to your preference. This level of customization ensures that the indicator integrates seamlessly into your existing TradingView setup.
Moreover, the indicator isn’t just about pattern recognition—it also incorporates outcome-based learning. Every time a pattern is detected, it looks ahead a predefined number of bars to evaluate if the expected reversal actually materialized. This outcome is then stored in arrays, and over time, the script dynamically calculates the probability of success for each pattern. These probabilities are presented in a real-time updating table on your chart, which shows not only the percentage probability but also the count of historical occurrences. With this information at your fingertips, you can quickly gauge the reliability of each pattern in your chosen market and timeframe.
Another significant advantage of this approach is its speed and efficiency. While more complex machine learning models like neural networks might require heavy computational resources and longer training times, the Naive Bayes classifier in this script is lightweight, instantaneous and can be updated on the fly with each new bar. This real-time capability is essential for modern traders who need to make quick decisions in fast-paced markets.
Furthermore, by automating the process of backtesting, the indicator frees up your time to focus on other aspects of trading strategy development. Instead of manually analyzing hundreds or even thousands of candles, you can rely on the statistical power of Naive Bayes to provide you with insights on which patterns are most likely to result in profitable moves. This not only enhances your efficiency but also helps to eliminate the cognitive biases that often plague manual analysis.
In summary, this indicator represents a fusion of traditional candlestick analysis with modern machine learning techniques. It harnesses the simplicity and effectiveness of Naive Bayes to deliver a dynamic, real-time evaluation of various candlestick patterns. Whether you are a seasoned trader looking to refine your technical analysis or a beginner eager to understand market dynamics, this tool offers a powerful, customizable, and efficient solution. Welcome to a new era where advanced statistical methods meet practical trading insights—happy trading and may your patterns always be in your favor!
Note : On this current released beta version, you must manually adjust reversal percentage move based on each market. Further updates may include automated best range detection and probability.
Bayesianprobability

Dual Bayesian For Loop [QuantAlgo]Discover the power of probabilistic investing and trading with Dual Bayesian For Loop by QuantAlgo , a cutting-edge technical indicator that brings statistical rigor to trend analysis. By merging advanced Bayesian statistics with adaptive market scanning, this tool transforms complex probability calculations into clear, actionable signals—perfect for both data-driven traders seeking statistical edge and investors who value probability-based confirmation!
🟢 Core Architecture
At its heart, this indicator employs an adaptive dual-timeframe Bayesian framework with flexible scanning capabilities. It utilizes a configurable loop start parameter that lets you fine-tune how recent price action influences probability calculations. By combining adaptive scanning with short-term and long-term Bayesian probabilities, the indicator creates a sophisticated yet clear framework for trend identification that dynamically adjusts to market conditions.
🟢 Technical Foundation
The indicator builds on three innovative components:
Adaptive Loop Scanner: Dynamically evaluates price relationships with adjustable start points for precise control over historical analysis
Bayesian Probability Engine: Transforms market movements into probability scores through statistical modeling
Dual Timeframe Integration: Merges immediate market reactions with broader probability trends through custom smoothing
🟢 Key Features & Signals
The Adaptive Dual Bayesian For Loop transforms complex calculations into clear visual signals:
Binary probability signal displaying definitive trend direction
Dynamic color-coding system for instant trend recognition
Strategic L/S markers at key probability reversals
Customizable bar coloring based on probability trends
Comprehensive alert system for probability-based shifts
🟢 Practical Usage Tips
Here's how you can get the most out of the Dual Bayesian For Loop :
1/ Setup:
Add the indicator to your TradingView chart by clicking on the star icon to add it to your favorites ⭐️
Start with default source for balanced price representation
Use standard length for probability calculations
Begin with Loop Start at 1 for complete price analysis
Start with default Loop Lookback at 70 for reliable sampling size
2/ Signal Interpretation:
Monitor probability transitions across the 50% threshold (0 line)
Watch for convergence of short and long-term probabilities
Use L/S markers for potential trade signals
Monitor bar colors for additional trend confirmation
Configure alerts for significant trend crossovers and reversals, ensuring you can act on market movements promptly, even when you’re not actively monitoring the charts
🟢 Pro Tips
Fine-tune loop parameters for optimal sensitivity:
→ Lower Loop Start (1-5) for more reactive analysis
→ Higher Loop Start (5-10) to filter out noise
Adjust probability calculation period:
→ Shorter lengths (5-10) for aggressive signals
→ Longer lengths (15-30) for trend confirmation
Strategy Enhancement:
→ Compare signals across multiple timeframes
→ Combine with volume for trade validation
→ Use with support/resistance levels for entry timing
→ Integrate other technical tools for even more comprehensive analysis

Bayesian Bias OscillatorWhat is a Bayes Estimator?
Bayesian estimation, or Bayesian inference, is a statistical method for estimating unknown parameters of a probability distribution based on observed data and prior knowledge about those parameters. At first , you will need a prior probability distribution, which is a prior belief about the distribution of the parameter that you are interested in estimating. This distribution represents your initial beliefs or knowledge about the parameter value before observing any data. Second , you need a likelihood function, which represents the probability of observing the data given different values of the parameter. This function quantifies how well different parameter values explain the observed data. Then , you will need a posterior probability distribution by combining the prior distribution and the likelihood function to obtain the posterior distribution of the parameter. The posterior distribution represents the updated belief about the parameter value after observing the data.
Bayesian Bias Oscillator
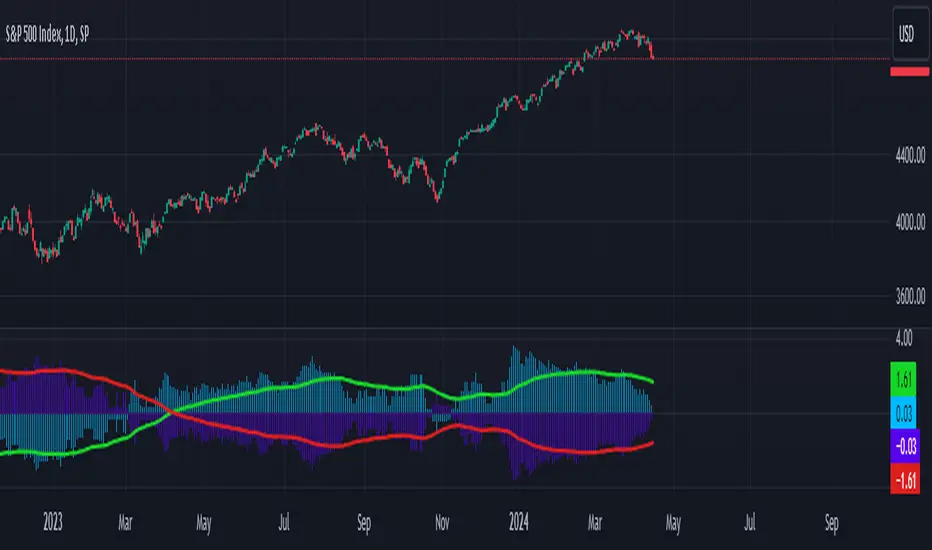
This tool calculates the Bayes bias of returns, which are directional probabilities that provide insight on the "trend" of the market or the directional bias of returns. It comes with two outputs: the default one, which is the Z-Score of the Bayes Bias, and the regular raw probability, which can be switched on in the settings of the indicator.
The Z-Score output value doesn't tell you the probability, but it does tell you how much of a standard deviation the value is from the mean. It uses both probabilities, the probability of a positive return and the probability of a negative return, which is just (1 - probability of a positive return).
The probability output value shows you the raw probability of a positive return vs. the probability of a negative return. The probability is the value of each line plotted (blue is the probability of a positive return, and purple is the probability of a negative return).