AlgoPilotX - Market Stages (VWMA + Reversals)This indicator identifies key market stages and potential trend reversals using stacked VWMAs. Bullish and bearish reversals are marked with green/up and red/down arrows, with a handy top-right info box showing the color coding for each stage.
It classifies the market into four stages:
Acceleration (Green) : All VWMAs stacked bullish, price above VWMA – strong upward momentum.
Accumulation (Silver) : VWMAs not stacked bullish, price above VWMA – early bullish build-up.
Deceleration (Red) : All VWMAs stacked bearish, price below VWMA – strong downward momentum.
Distribution (Orange) : VWMAs not stacked bearish, price below VWMA – early bearish buildup.
It also highlights Bullish and Bearish Reversals with green/up and red/down arrows (“R”) directly on the chart, making it easy to spot potential trend changes.
A fixed info box in the top-right corner summarizes the color coding for quick reference.
Alerts are available for all stages and reversals, so you can automate notifications for key market events.
Bearish-signals

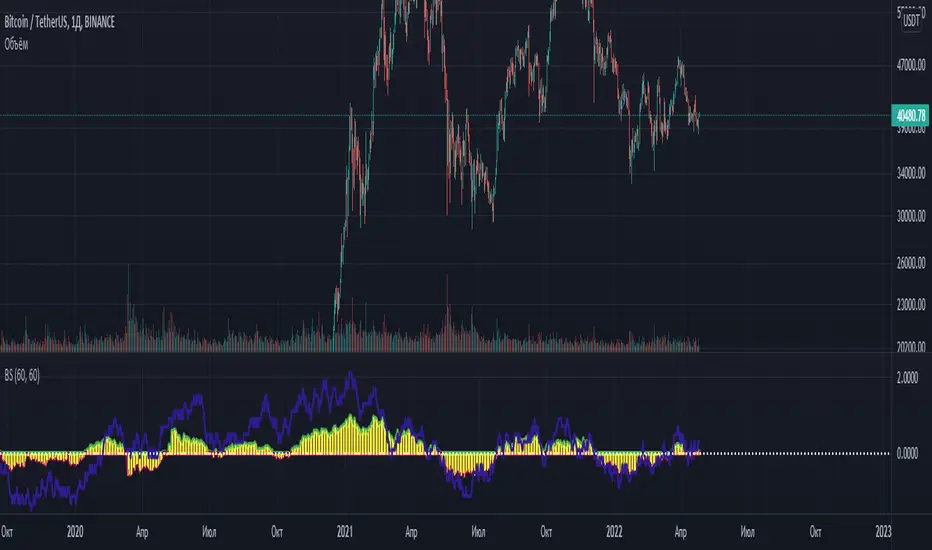
Botvenko ScriptI just test&learn pine script...
Damn, what should I write here? So... Its just a differense between the logarithms of two prices of different periods (You can set the period you want)... And it looks really nice... Ahem...
I hope, you enjoy this piece of... Have a nice day, my dear.
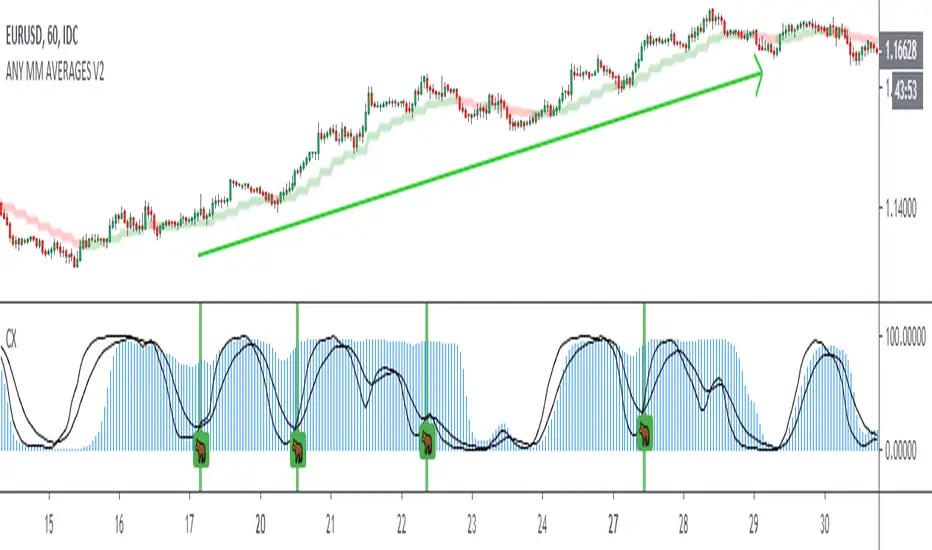
Crack XThis indicator looks for cracks (de-correlation of 2 indicators), what you have to do is simple, first look at the trend in a higher frame, there are many indicators for this, then look for cracks as wide as possible (you can configure the size in the configuration) and that they are not close to important supports / resistances. This indicator can be very useful for Swing, Coverages, to increase existing positions.The confirmation of the crack occurs when the black lines cross + bar closure.
- Added Alerts
Premium Stochastic OscillatorThe PSO is a rewired version of a short-period stochastic. Unlike a standard stochastic oscillator, this indicator is normalized to register neutral values at zero while providing greater sensitivity to short-term price moves. This indicator uses a central zero line as a reference point and will oscillate above and below this point as price fluctuates. In addition, the PSO is smoothed by using a double exponential moving average to provide a more even response to turns in the market.
(from TASC magazine, August 2008 issue).
The Premium Stochastic Oscillator was introduced by technical analyst Lee Leibfarth.

TMMS OscillatorThe TMMS oscillator (aka “Trading Made More Simpler”) is an indicator made of conditions based on both 2 separated Stochastic and 1 RSI.
Bullish zone is green and bearish one is red. When the histogram is grey, no signals is available at that time.
The indicator has an option to show the current trend of an Hull moving average (ascending or descending curve). When the trend is up, green dots are plotted on the zero line. When the trend is down, the dots are coloured in red.
Greetings, success with your trade!!!

