[CT] ORB SuiteThis indicator is an Opening Range first tool that also includes an Initial Balance framework, breakout detection, and a full target and alerting package. It is designed to define a clean Opening Range at the start of the regular trading session and then turn that range into an actionable breakout structure by plotting the key levels, projecting measured targets, and visually confirming the exact breakout candle on your chart. The Opening Range component can be configured as either the first bar of the session or a true time-based duration, such as 1, 2, 5, 10, 15, 30 minutes, or 1 hour, which lets you standardize the opening structure across different chart timeframes without needing to “count bars.” As price prints during the Opening Range window, the script continuously updates the OR high and OR low, then locks those levels once the window closes so you have a stable reference for the rest of the session. The OR area can be shaded for quick visual recognition, and an optional OR midpoint line and label can be displayed to help you judge whether price is accepting above the middle of the range or failing back through it.
Once the Opening Range is formed, the script upgrades the workflow by adding breakout qualification rules that you can control. You can choose confirmation based on a body cross, a close cross, or a close above or below the range boundary, which is a meaningful improvement over simple “touch” logic because it helps reduce false signals and makes the breakout trigger more consistent with how you actually trade. When a breakout is confirmed, the indicator can highlight the breakout candle itself so there is no ambiguity about which bar triggered the signal. You can highlight the candle body, the chart background, or both, and you can select separate colors for long and short breakouts. This makes chart review and live decision-making cleaner because you can immediately see where the breakout truly occurred instead of guessing between several candles that probed the level.
The next major upgrade is the breakout target system. After a long breakout, targets are calculated as true multiples of the Opening Range size, starting from the OR high and projecting upward by the selected multiples. After a short breakout, targets are calculated from the OR low and projected downward by the same multiple logic. By default, the script supports four take-profit targets, TP1 through TP4, with sensible preset multiples that step outward in a structured way, but you can customize each multiple to match your instrument and style. This target system is a practical enhancement because it provides objective, range-based profit-taking levels that align with common intraday expansion behavior rather than arbitrary fixed tick offsets. You also get full control over whether the target lines and labels appear only after a breakout triggers, which keeps the chart clean and prevents “pre-biasing,” or whether you want to see projected targets in both directions before the breakout occurs for planning and scenario mapping. In addition, the target hit detection is configurable so you can decide whether a target is considered “hit” by a simple high or low touch or only after a close crosses the target, which is important for traders who want stricter confirmation and cleaner backtesting logic.
Beyond the OR and targets, the indicator includes a complete Initial Balance module as an additional layer of structure. The IB duration is selectable and independent, and the script can plot IB high, IB low, and an optional IB midpoint, with optional fill shading to make the balance area obvious. A key upgrade here is the ability to base the breakout targets on either the Opening Range or the Initial Balance. This means you can run a pure OR breakout playbook, a pure IB breakout playbook, or compare both structures on the same session without changing indicators. This flexibility matters because OR breakouts tend to be more sensitive and earlier, while IB-based levels often better reflect the session’s early balance and can produce more stable expansion targets.
Another major improvement is the history and session management. The script can freeze all drawings at the end of the session so lines and fills do not incorrectly extend into the next day, and it can optionally keep a configurable amount of history, such as the last 20 sessions, so you can study how price reacts to prior OR and IB structures. You also have control over whether IB should be included in that stored history, which helps if you want a cleaner chart while still retaining the OR context. To support different chart themes and personal preferences, label styling is expanded with controls for label background colors, text colors, transparency, and horizontal offsets, so the levels remain readable without covering price action.
Finally, the alerting system is upgraded into a full set of actionable events. The indicator can generate alerts for session open and session close, for the moment the Initial Balance forms, for the moment the Opening Range forms, for long and short breakouts, and for each target hit from TP1 through TP4. Alerts can be used in standard alertcondition form or as dynamic alert() calls that include price-filled messages, which is a practical enhancement for traders who want their phone or desktop notifications to contain the exact level values rather than generic labels.
This script is a derivative work built on the original Initial Balance foundation authored by © czoa under the Mozilla Public License 2.0, with extensive additions and improvements by © ChaosTrader63 to expand it into a complete Opening Range and Initial Balance breakout suite. The core upgrades are the configurable time-based Opening Range, breakout candle highlighting, multi-target measured range projections through TP4 with optional pre-projection behavior, stricter breakout confirmation modes, target hit rules, richer history controls, stronger label customization, and a comprehensive alert system that turns the session structure into a usable trade planning and execution framework directly on TradingView.
Сила медведей

Multi-Timeframe RSI (4x) z Podświetlaniem - PawełRSI z podświetleniem z różnych tfów z ustawianiem intensywnosci i kolorów.

[L2] Enhanced MACD Support-Kisslooking for support line, before pumping, script can find where possible points for enter

Weighted Bulls-Bears Variety Smoothed [Loxx]Weighted Bulls-Bears Variety Smoothed highlights potential buy and sell moments in the market. Users can customize the data source and select their preferred type of moving average for calculations. The resulting visualization is a column-style plot that changes color based on bullish or bearish market conditions. Additionally, the script can color chart bars and provide visual markers to indicate buying ("Long") or selling ("Short") opportunities. Alerts can also be set for these trading signals.
█ Inputs:
Users can choose the source for calculations (e.g., closing price).
They can set periods for calculations and smoothing.
They can select the type of moving average they prefer for smoothing: EMA, FEMA, LWMA, SMA, or SMMA.
█ Weighted Bulls-Bears Calculation:
It determines the highest and lowest prices over a user-defined period.
Then, it calculates the 'bull' and 'bear' values based on these highest and lowest prices. These values are weighted based on their distance from the current price.
█ Extras
Alerts
Signals

Infiten's Adjusted Bull-Bear Power Oscillator An extension of TradingView's new ADR and bull-bear power indicators, this indicator is helpful for spotting abnormal bullish and bearish activity to get good contrarian entry points.
How to interpret the indicator
When the white columns cross over the red line, it's a bearish indicator since the asset has been overbought.
When the white columns cross under the green line, it's a bullish indicator since the asset has been oversold.
How it's calculated
The adjusted bull-bear power oscillator is calculated by multiplying the bull-bear power indicator by my NDO indicator, to adjust the bull-bear power for volume. The upper green line and lower red line are calculated as the product of a multiplier input and the average daily range indicator.

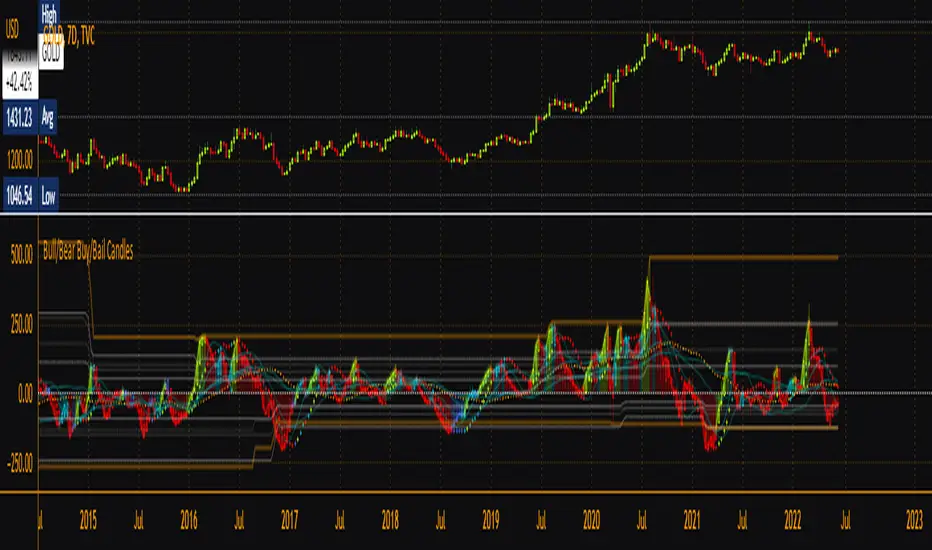
Bull/Bear Buy/Bail CandlesBased on BullBearPower indicator, this is a heavily modified version with colored candles to show when bulls or bears are buying or bailing. Includes Fibonacci Levels based on Highest/Lowest value in variable length, along with optional second timeframe and alternative calculation for candles and linear regression curves for increased versatility. Green = bullish /long, Aqua = still-bullish albeit weakening, blue = weak albeit strengthening and red = weak/short. Perfect as a confirmation indicator for those looking to time markets.
Bears Bulls Impulse [Loxx]Bears Bulls Impulse, originally known as the the Elder-Ray Index, is a technical indicator developed by Dr. Alexander Elder that measures the amount of buying and selling pressure in a market. This indicator consists of two indicators known as "bull power" and "bear power," which are derived from a 13-period moving average.
Included:
- Various average modes to fine-tune the signal
This is an exact clone of the "Bears Bulls Impulse" MT4 indicator

Price ActionFirst, you have to know price action, RTM price action Handbook could help you
this indicator shows you base and momentum candles
base candles could be zones of trade that show you fighting of bulls and bears, and momentum candles could show the power of those zones.
Base candles are white in the chart, and you can place your order at the good zone.
Rally candles and drop candles are momentum candles, and bold rally and bold drop show that it is more powerful than its before candle.
Zigzag compression is one way that shows the compression in trend.
it looks like the Wedges pattern at classic technical that shows pending orders are closed, so the target zone could be powerful to reverse the trend.
Black background of candle means that candle doesn't reach its before candle and so it is poor candle, I named it domination.
It is better to do not trade at poor candles.
At the end, I find Price action the best way to trade, and it makes you free of other indicator, even volume indicator.
This indicator is good for those who use price action strategy to trade and those who want to learn the price action.
It could be so helpful and reliable way to find the zones, and place buy or sell order and the target, specially for scalping.

Bear & Bull Zone Trend AlertsThis script was requested based on what I previously had in my other scripts.
I did do some tweaks based on some assumptions of what I think it will be used for.

{Gunzo} Bulls Power vs. Bears PowerBulls Power vs. Bears Power is a unique tool that displays on each candle the balance between the bears (sellers) and the bulls (buyers).
OVERWIEW :
This indicator is mainly based on the popular indicator “Elder ray” made by Dr. Alexander Elder in 1989. This indicator has been developed in order to determine the strength of the competing groups of buyers and sellers in the markets.
CALCULATION :
To measure the competing power of bulls and bears, the indicator compares the current high (maximum power of the bulls) and current low (maximum power of the bears) to the average price using a exponential moving average.
Bull Power = Current High – EMA 13 (closing)
Bear Power = Current Low – EMA 13 (closing)
This Elder ray indicator can also tell us more information about market conditions :
If the current high and current low are above the EMA 13, the bulls are totally in control on the market
If the current high and current low are under the EMA 13, the bears are totally in control of the market
If the EMA 13 is in between of the current high and current low, there is strong fight about controlling the market, there is possible reversal in this configuration
SETTINGS :
Fast MA Period : Fast moving average period (only used for buy sell signal)
Slow MA Period : Slow moving average period (only used for buy sell signal)
Display candle labels : Show/hide candle labels on the chart
Display only bear labels above X : Exclude all top candle labels on the chart below the value specified.
Display only bull labels above X : Exclude all bottom candle labels on the chart below the value specified.
Display opposite values : Show all candle labels on top (bearish) and bottom (bullish) or only show the candle labels for the winning force on the candle.
Display box for last candle : Show/hide the dominance boxes (red and blue) after last candle showing the last bear and bull power.
Display box after X candles : How many candles in the future the dominance boxes should be displayed.
Display slow / fast crossover (o) : Display crossover signals (circles) between fast line and slow line.
Display bear / bull fighting (x) : Display fighting signals (crosses) between bull and bears.
VISUALIZATIONS :
This indicator has 3 possible complementary visualizations:
Candle labels : The labels on top are the percentage of the bears on the candle, while the labels on the bottom are the percentage of the bulls on the candle. When the bulls are winning the labels are blue, when the bears are winning the labels are red, silver otherwise.
Box after last candle : The blue and red boxes after the last candle are the percentage of bears and bulls on the last candle of the chart. That boxes can be disabled in the settings if you feel it is redundant with the labels.
Signals : The signals are displayed at the bottom of the main area of trading. The orange “x” represents an area where bulls and bears are fighting hard. The blue “o” represents a buy signal (fast line crosses over the slow line) and the red “o” represents a sell sinal (fast line crosses under the slow line).
USAGE :
The most important rule in the usage of this indicator is :
“The higher the current bull power is (or bear power), the higher the chances are the next candle will also be bullish (or bearish).”
When the prices is increasing, it is very interesting to follow the bull power to verify that it is either stable or increasing. If the bull power keeps decreasing candle after candle, there is chances that in the next candles there will be a reversal.
When there is orange crosses in the signal area (bottom of the screen), it means that there is a big fight between bulls and bears and that the current price of the asset is probably stable. During these fighting areas, reversals are more likely to happen.
When there is a blue circle in the signal area (or red signal), it can be considered as a buy signal (or sell signal). These signals are determined by the crossover of the fast and slow lines of the total power of the bulls plus the bears.
LIMITATIONS :
As Pine script only allows to display about 50 drawings on the chart, the labels on the candles can not be printed on all the historical candles. The option “Display opposites” could be useful to hide unnecessary labels and then be able to display more older labels.
As the Elder ray indicator uses an average price (EMA 13 of closing price), the indicator may be lagging in some situations, but most of the time it will help to filter the bad signals contrary to the indicators that are too reactive.

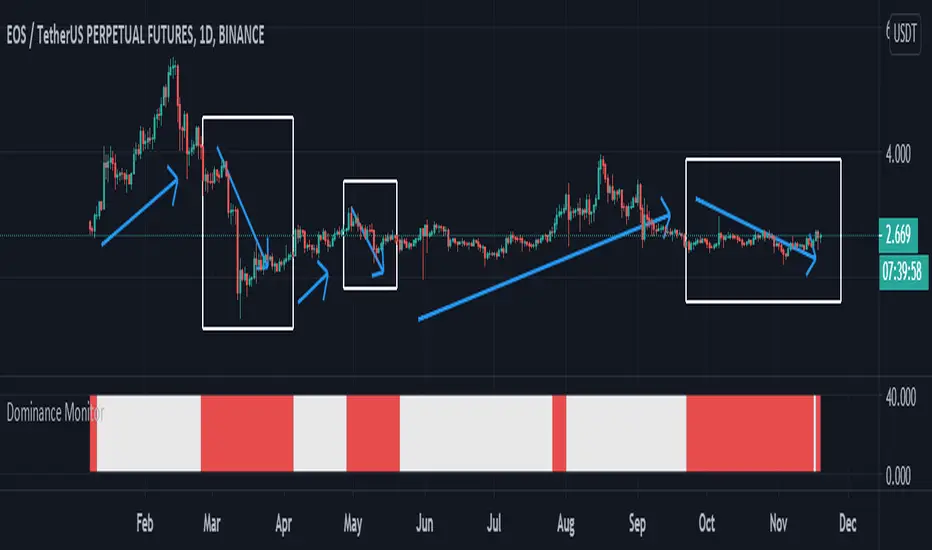
Dominance Monitoralways a trader must check the bitcoins Dominance and if its ok can make a deal on AltCoins
this indicator Monitor the BTC.D and check the trend with ATR and give you results
please just check it in 1D timeframe
when the color was white you can easily trade and if the color was red you should be aware the risk and rest or maybe close the deals
BINANCE:EOSUSDT
be our guest
Simple Truncation FunctionMain utility: legibility in alerts where certain values are not truncated.
It may prove helpful if tostring() is unavailable for use as well.

Bull vs Bear Power by DGTElder-Ray Bear and Bull Power
Dr. Alexander Elder cleverly named his first indicator Elder-Ray because of its function, which is designed to see through the market like an X-ray machine. Developed in 1989, the Elder-Ray indicator can be applied to the chart of any security and helps traders determine the strength of competing groups of bulls and bears by gazing under the surface of the markets for data that may not immediately be ascertainable from a superficial glance at prices
The Elder-Ray indicator is comprised by three elements – Bear Power, Bull Power and a 13-period Exponential Moving Average.
As the high price of any candle shows the maximum power of buyers and the low price of any candle shows the maximum power of sellers, Elder uses the 13-period EMA in order to present the average consensus of price value. Bull power shows whether buyers are capable of pushing prices above the average consensus of value. Bear power shows whether sellers are capable of pushing prices below the average consensus of value. Mathematically, Bull power is the result of subtracting the 13-period EMA from the high price of the day, and Bear power is the result of subtracting the 13-period EMA from the low price of the day.
What does this study implements
Attempts to customize interpretation of Alexander Elder's Elder-Ray Indicator (Bull and Bear Power) by
• adding additional insights to support/confirm Elder’s strategy with different indicators related with the Elder’s concept
• providing different options of visualization of the indicator
• providing smoothing capability
Other Indicators to support/confirm Elder-Ray Indicator:
Colored Directional Movement Index (CDMI) , a custom interpretation of J. Welles Wilder’s Directional Movement Index (DMI) , where :
DMI is a collection of three separate indicators ( ADX , +DI , -DI ) combined into one and measures the trend’s strength as well as its direction
CDMI is a custom interpretation of DMI which presents ( ADX , +DI , -DI ) with a color scale - representing the trend’s strength, color density - representing momentum/slope of the trend’s strength, and triangle up/down shapes - representing the trend’s direction. CDMI provides all the information in a single line with colored triangle shapes plotted on the top. DMI can provide quality information and even trading signals but it is not an easy indicator to master, whereus CDMI simplifies its usage.
Alexander Elder considers the slope of the EMA, which gives insight into the recent trend whether is up or down, and CDMI adds additional insight of verifying/confirming the trend as well as its strength
Note : educational content of how to read CDMI can be found in ideas section named as “Colored Directional Movement Index”
different usages of CDMI can be observed with studies “Candlestick Patterns in Context by DGT", “Ichimoku Colored SuperTrend + Colored DMI by DGT”, “Colored Directional Movement and Bollinger Band's Cloud by DGT”, and “Technical Analyst by DGT”
Price Convergence/Divergence , if we pay attention to mathematical formulations of bull power, bear power and price convergence/divergence (also can be expressed as price distance to its ma) we would clearly observe that price convergence/divergence is in fact the result of how the market performed based on the fact that we assume 13-period EMA is consensus of price value. Then, we may assume that the price convergence/divergence crosses of bull power, or bear power, or sum of bull and bear power could be considered as potential trading signals
Additionally, price convergence/divergence visualizes the belief that prices high above the moving average or low below it are likely to be remedied in the future by a reverse price movement
Alternatively, Least Squares Moving Average of Price Convergence/Divergence (also known as Linear Regression Curve) can be plotted instead of Price Convergence/Divergence which can be considered as a smoothed version of Price Convergence/Divergence
Note : different usages of Price Convergence/Divergence can be observed with studies “Trading Psychology - Fear & Greed Index by DGT”, “Price Distance to its MA by DGT”, “P-MACD by DGT”, where “Price Distance to its MA by DGT” can also be considered as educational content which includes an article of a research carried on the topic
Options of Visualization
Bull and Bear Power plotted as two separate
• histograms
• lines
• bands
Sum of Bull and Bear Power plotted as single
• histogram
• line
• band
Others
Price Convergence/Divergence displayed as Line
CDMI is displayed as single colored line of triangle shapes, where triangle shapes displays direction of the trend (triangle up represents bull and triangle down represent bear), colors of CDMI displays the strength of the trend (green – strong bullish, red – strong bearish, gray – no trend, yellow – week trend)
In general with this study, color densities also have a meaning and aims to displays if the value of the indicator is falling or growing, darker colors displays more intense move comparing to light one
Note : band's upper and lower levels are calculated by using standard deviation build-in function with multiply factor of 0.236 Fibonacci’s ratio (just a number for our case, no any meaning)
Smoothing
No smoothing is applied by default but the capability is added in case Price Convergence/Divergence Line is assumed to be used as a signal line it will be worth smoothing the bear, bull or sum of bear and bull power indicators
Interpreting Elder-Ray Indicator, according to Dr. Alexander Elder
Bull Power should remain positive in normal circumstances, while Bear Power should remain negative in normal circumstances. In case the Bull Power indicator enters into negative territory, this implies that sellers have overcome buyers and control the market. In case the Bear Power indicator enters into positive territory, this indicates that buyers have overcome sellers and control the market. A trader should not go long at times when the Bear Power indicator is positive and he/she should not go short at times when the Bull Power indicator is negative.
13-period EMAs slope can be used in order to identify the direction of the major trend. According to Elder, the most reliable buy signals are generated, when there is a bullish divergence between the Bear Power indicator and the price (Bear Power forms higher lows, while the market forms lower lows). The most reliable sell signals are generated, when there is a bearish divergence between the Bull Power indicator and the price (Bull Power forms lower highs, while the market forms higher highs).
There are four basic conditions, required to go long or short, with the use of the Elder-Ray method alone.
In order to go long:
1. The market is in a bull trend, as indicated by the 13-period EMA
2. Bear Power is in negative territory, but increasing
3. The most recent Bull Power top is higher than its prior top
4. Bear Power is going up from a bullish divergence
The last two conditions are optional that fine-tune the buying decision
In order to go short:
1. The market is in a bear trend, as indicated by the 13-period EMA
2. Bull Power is in positive territory, but falling
3. The most recent Bear Power bottom is lower than its prior bottom
4. Bull Power is falling from a bearish divergence
The last two conditions are optional, they provide a stronger signal for shorting but they are not absolutely essential
If a trader is willing to add to his/her position, he/she needs to:
1. add to his/her long position, when the Bear Power falls below zero and then climbs back into positive territory
2. add to his/her short position, when the Bull Power increases above zero and then drops back into negative territory.
note : terminology of the definitions used herein are as per TV dictionary
Trading success is all about following your trading strategy and the indicators should fit within your trading strategy, and not to be traded upon solely
Disclaimer : The script is for informational and educational purposes only. Use of the script does not constitute professional and/or financial advice. You alone have the sole responsibility of evaluating the script output and risks associated with the use of the script. In exchange for using the script, you agree not to hold dgtrd TradingView user liable for any possible claim for damages arising from any decision you make based on use of the script

Elder-ray Index// 2020.7.26 version
// This indicator is for the second filter in Triple Screen Trading System which can show bearish power and bullish power
// indicator rule
// if showbull is true, show bullish power, if showbull is false, show bearish power
// if Trend is bull, buy when bearish power is getting back from the lowest but still under zero
// if Trend is bear, short when bullish power is going down from the highest but still up zero
// now only draw line but not histgram
// As for how to decide bullish market or bearish market, please check it according to the first filter of Triple Screen Trading System

Modiied Elder Ray Index(Bull or Bear)Here's a modified version of the Elder Ray Index created by the famed Dr.Alexander Elder. This indicator has proven to be especially helpful lately given the crazy state of crypto.
Slow Moving Average :
The top chart shows the moving average used to filter trends. I recommend using a higher window length(can be adjusted with the 'lenSlowMA' input option). I wanted this to be a very smooth moving average, so I used the following formula:
slow MA = ema(vwma(close, 64), 64)
This resulted in a pretty smooth line that still detects major price movements very well.
-The background and bar colors both change in response to the Slow MA's value. The background and bars change to green when a bullish trend is detected and red when bearish.
Bear and Bull Power :
To balance things out a little, I included two histogram's based on Elder's Ray. Here, a more responsive EMA with a shorter window length is used to calculate the bull and bear power values and track short-term price fluctuations.
NOTE: The length of the EMA used here can be adjusted in the input menu.
Bull Power = current high - EMA(close, 13)
Bear Power = current low - EMA(close, 13)


Bulls Bears PowerПростенький осциллятор, который показывает силу быков (зеленая гистограмма) и медведей (красная гистограмма) и преобладание одних над другими (белая гистограмма).
Buffet indicatorI was tired of not having something to compare the real economic strength of a country (US only for now...) to it's companies valuations.
So I made my own! Trading view does not have the wilshire indice, but it has the Rus 3000, good enough, & the US GDP since 1946 so this is what I am using.
Warren Buffet is famous for liking this so now the idea has its name. Let's call it the Buffet indicator (I doubt the only one that had the idea).
This indicator can be used on any indice thought, even on specific stocks.
You can even use it as a filter with an alarm (ofc not to be used on its own but patient people can really go far if they ONLY invest when the ratio is at the bottom, just as long as it is in the right companies):
One could invest in the middle of the highest green area (waiting for it to go too low = risk missing out), and add more when it goes to the second green area, for example. You sort it out.
Enjoy! See you on Mars luxury station in 25 years (the one I will build).

Total Power IndicatorHello traders!
This indicator was originally developed by Daniel Fernandez (Currency Trader magazine, 2011).
It is based on the two well-known indicators by Dr. Alexander Elder - Bulls Power and Bears Power.
Signals
1) Long when Bull and Total lines indicate 100 (it happens rarely)
2) Short when Bear and Total lines indicate 100 (it happens rarely)
3) Bull and Bear lines crossovers
4) Long when Bull line crosses Total line from below
5) Short when Bear line crosses Total line from below
6) Long/Short when Bull/Bear lines cross adjustable level.
Like and follow for more open source indicators!
Happy Trading!

Elder's Force Index Double combined by iduThe idea is to see Elder's force index smoothed EMA in different time frame simultaneously.
Default intervals are (2) and (13)
Base on samuel16 script.

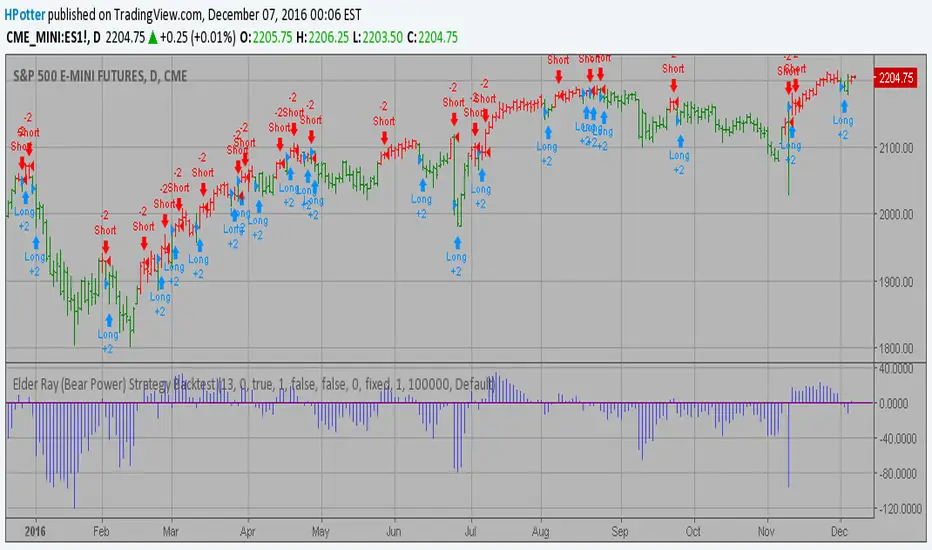
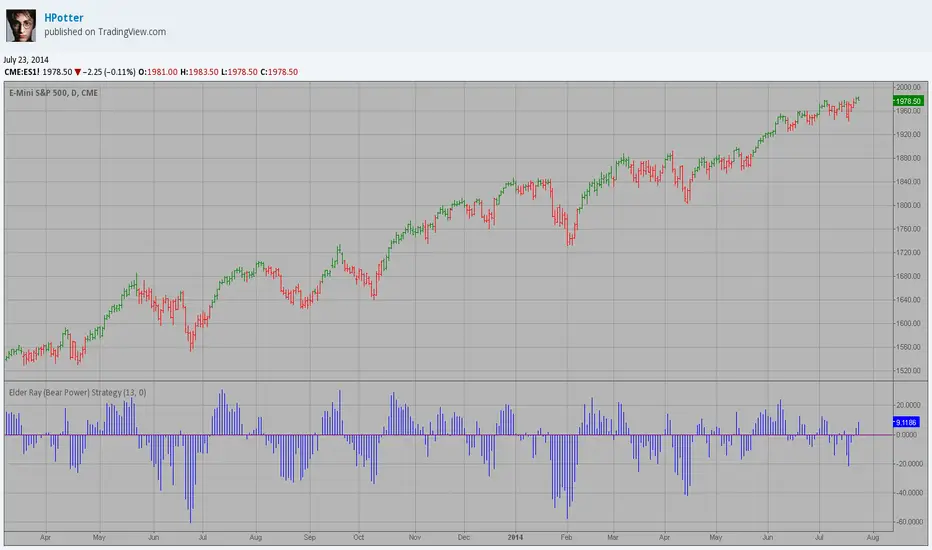
Elder Ray (Bear Power) Strategy Backtest Developed by Dr Alexander Elder, the Elder-ray indicator measures buying
and selling pressure in the market. The Elder-ray is often used as part
of the Triple Screen trading system but may also be used on its own.
Dr Elder uses a 13-day exponential moving average (EMA) to indicate the
market consensus of value. Bear Power measures the ability of sellers to
drive prices below the consensus of value. Bear Power reflects the ability
of sellers to drive prices below the average consensus of value.
Bull Power is calculated by subtracting the 13-day EMA from the day's High.
Bear power subtracts the 13-day EMA from the day's Low.
You can use in the xPrice any series: Open, High, Low, Close, HL2, HLC3, OHLC4 and ect...
You can change long to short in the Input Settings
Please, use it only for learning or paper trading. Do not for real trading.
Elder Ray (Bear Power) Strategy Developed by Dr Alexander Elder, the Elder-ray indicator measures buying
and selling pressure in the market. The Elder-ray is often used as part
of the Triple Screen trading system but may also be used on its own.
Dr Elder uses a 13-day exponential moving average (EMA) to indicate the
market consensus of value. Bear Power measures the ability of sellers to
drive prices below the consensus of value. Bear Power reflects the ability
of sellers to drive prices below the average consensus of value.
Bull Power is calculated by subtracting the 13-day EMA from the day's High.
Bear power subtracts the 13-day EMA from the day's Low.
You can use in the xPrice any series: Open, High, Low, Close, HL2, HLC3, OHLC4 and ect...
Elder Ray (Bear Power) Developed by Dr Alexander Elder, the Elder-ray indicator measures buying
and selling pressure in the market. The Elder-ray is often used as part
of the Triple Screen trading system but may also be used on its own.
Dr Elder uses a 13-day exponential moving average (EMA) to indicate the
market consensus of value. Bear Power measures the ability of sellers to
drive prices below the consensus of value. Bear Power reflects the ability
of sellers to drive prices below the average consensus of value.
Bull Power is calculated by subtracting the 13-day EMA from the day's High.
Bear power subtracts the 13-day EMA from the day's Low.
You can use in the xPrice any series: Open, High, Low, Close, HL2, HLC3, OHLC4 and ect...
