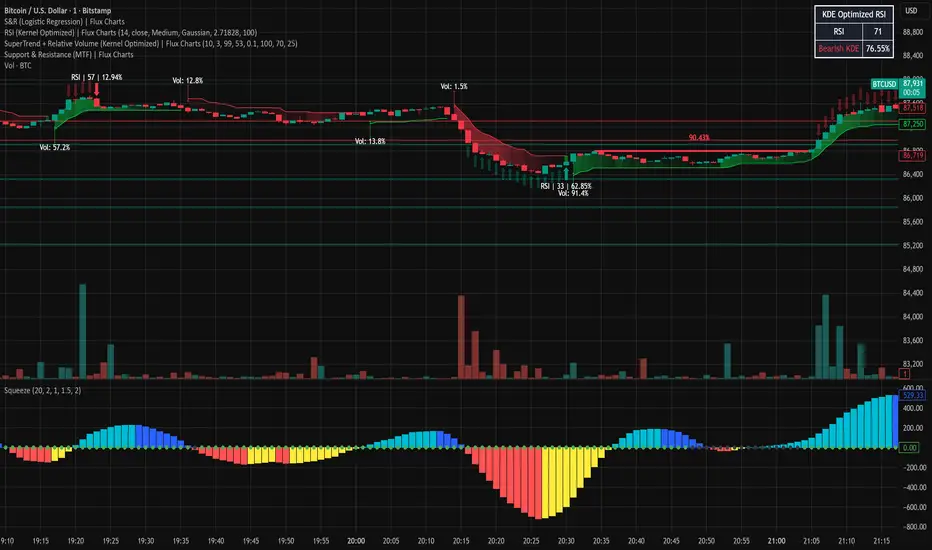
Индикаторы ширины рынка

LETHINH RSITitle:
RSI + EMA9 + WMA45 Strength Flow Indicator
Description:
This indicator enhances the traditional RSI by combining it with two dynamic moving averages (EMA9 and WMA45) applied directly to the RSI line. The goal is to help traders visually identify momentum strength, trend confirmation, and potential reversal points with greater accuracy.
How It Works:
• RSI (14): Measures market momentum and identifies overbought/oversold conditions.
• EMA9 on RSI: A fast-response signal line that tracks short-term shifts in buyer/seller strength.
• WMA45 on RSI: A slower, smoother indication of long-term momentum flow and trend bias.
Key Signals:
1. EMA9 crosses above WMA45: Momentum turning bullish → potential buy signal.
2. EMA9 crosses below WMA45: Momentum turning bearish → potential sell signal.
3. RSI above 50 + EMA9 above WMA45: Strong bullish environment.
4. RSI below 50 + EMA9 below WMA45: Strong bearish environment.
5. RSI approaching 70/30: Warning zones for exhaustion or potential reversals.
Use Cases:
• Spot momentum reversals earlier than RSI alone.
• Confirm entries when price structure and momentum agree.
• Filter out false breakouts during low-volatility or choppy conditions.
• Strength-based scalping, swing trading, or trend following.
Best Timeframes:
Works on all timeframes, especially effective on M1–M15 for scalping and H1–H4 for swing trading.

Altseason IndexDescription of the "Altseason Index" Indicator
The Altseason Index is a powerful and visually minimalist tool designed to objectively identify the onset and conclusion of an "altseason" in the cryptocurrency market. Moving beyond subjective speculation, this indicator employs a clear, mathematical methodology by comparing the performance of a broad basket of altcoins against Bitcoin.
🎯 Core Concept and Utility
An "Altseason" is a market period where altcoins (cryptocurrencies other than Bitcoin) consistently yield higher returns than BTC. This indicator empowers traders and investors to:
Objectively Identify Market Cycles: Precisely pinpoint when capital is actively rotating from Bitcoin into altcoins and vice versa.
Make Data-Driven Decisions: Adjust their strategy in a timely manner: increasing exposure to altcoins during an altseason or rotating back into BTC upon its conclusion.
Avoid Emotional Pitfalls: Steer clear of FOMO (Fear Of Missing Out) and base decisions on hard data rather than market noise.
⚙️ How the Calculation Works
1. Asset Selection: The indicator tracks the performance of 15 leading altcoins across various market segments (Layer 1s, DeFi, Meme, Payments), ensuring a representative sample.
2. Performance Comparison: For each altcoin, the percentage price change over the user-defined lookback period (default: 90 days) is calculated. This performance is then compared to BTC's performance over the same period.
3. Counting the "Outperformers": The index counts the number of altcoins that have "outperformed" BTC.
4. Calculating the Index: The Altseason Index value is the percentage of altcoins in the basket that are outperforming BTC. For example, a value of 60% means that 9 out of the 15 coins performed better than Bitcoin.
🛠️ Indicator Settings
The settings are kept simple and intuitive, allowing you to customize the indicator to your strategy:
Lookback Period (days) (Default: 90):
- Defines the time horizon for the performance calculation.
- Shorter Periods (30-60 days) react faster to new trends but may produce more false signals.
- Longer Periods (90-180 days) provide smoother and more reliable signals, capturing sustained macro-trends.
Altseason Threshold (%) (Default: 75%):
- This is the key parameter that defines what index value constitutes an official "altseason."
- A threshold of 75% means an altseason is declared when at least 11 out of the 15 altcoins (75%) are outperforming BTC.
- You can increase the threshold (e.g., to 85%) for more conservative and stronger signals, or decrease it (e.g., to 65%) for earlier entries.
📊 Interpreting the Readings and Signals
The indicator uses a clear color-coding system and levels for easy interpretation:
🔴 < 30%: "BTC SEASON"
Bitcoin is dominating. The market is in risk-off mode or a state of anticipation. Growth is concentrated in BTC.
⚪ 30% - 49%: "NEUTRAL"
A transitional phase. The market is uncertain. Some alts show strength, but there is no unified trend.
🔵 50% - 74%: "BULLISH"
Growing strength in altcoins. Capital is beginning to rotate actively. This can be an early stage of an altseason.
🟢 ≥ 75% (or your custom threshold): "ALTSEASON"
The active altseason phase. The vast majority of altcoins are rising faster than BTC. This is the period of maximum potential returns for alts.
Signal Markers:
Green Dot: Signals the potential start of an altseason (the index crosses above the threshold).
Red Dot: Signals the potential end of an altseason (the index crosses below the threshold).
ℹ️ Information Panel
The chart displays two clean information panels:
1. Main Info Label:
Current index value (e.g., ⟠ 80%).
Market status (ALTSEASON, BULLISH, etc.).
The ratio of outperforming altcoins (11/15 alts).
2. Dominance & Market Cap Panel:
Alts: Altcoin Dominance (the market cap share of all coins except BTC).
BTC: Bitcoin Dominance.
Market: Total cryptocurrency market capitalization in billions of USD. This helps assess the overall market context (bullish/bearish).
💎 Conclusion
The Altseason Index is your strategic companion for navigating the crypto markets. It transforms the complex task of identifying market cycles into a simple and visual process. Use it to confirm broad market trends, identify potential entry and exit points, and, most importantly, to maintain discipline in your trading strategy by filtering out noise and emotion.
Disclaimer: This indicator is a tool for analysis and does not constitute investment advice. All trading decisions are taken at your own risk.

Thirdeyechart Global Gold PercentageThe global gold percentage – Percentage Change Indicator is a TradingView tool developed to help traders monitor multiple currency pairs and precious metals in one glance. This indicator was coded personally, using custom formulas to calculate the percentage change for each symbol over selected timeframes, making it unique and fully tailored to individual analysis needs.
Users can input any symbols they wish to track as a comma-separated list, making it highly flexible. The script automatically calculates percentage changes for Daily (D), 1-Hour (H1), and 4-Hour (H4) timeframes. Positive changes are highlighted in blue and negative changes in red, allowing for an instant visual representation of market movements. The table updates in real-time, giving traders immediate feedback without needing to switch between charts.
Designed with simplicity and functionality in mind, this indicator is ideal for intraday traders, swing traders, or anyone who wants to keep an eye on multiple markets efficiently. It works for currency pairs, metals like gold (XAUUSD, XAUJPY), or any TradingView-available symbol. The table is positioned at the top-right corner of the chart and automatically adapts to the number of symbols entered.
This script is purely informational and educational, providing a clear view of price movements but not offering buy or sell signals. Traders should perform their own analysis and risk management before making any trading decisions.
Disclaimer / Copyright:
© 2025 Thirdeyechart. All rights reserved. This indicator is for educational and informational purposes only. The author is not responsible for any trading losses or financial decisions made based on this script. Redistribution, copying, or commercial use of this code without permission is strictly prohibited.

RRE HARSI4951✅ Buy Signal
RSI crosses above 49
Heikin Ashi green (ha_close > ha_open)
✅ Sell Signal
RSI crosses below 51
Heikin Ashi red (ha_close < ha_open)
Everything else in your code remains unchanged.

Delta Zones Smart Money Concept (SMC) UT Trend Reversal Mul.Sig.🚀 What's New in This Version (V5 Update)
This version is a major overhaul focused on improving trade entry timing and risk management through enhanced UT Bot functionality:
Integrated UT Trailing Stop (ATR-based): The primary trend filter and moving stop-loss mechanism is now fully integrated.
Pre-Warning Line: A revolutionary feature that alerts traders when the price penetrates a specific percentage distance (customizable) from the UT Trailing Stop before the main reversal signal fires.
"Ready" Signal: Plots a "Ready" warning label on the chart and triggers an alert condition (UT Ready Long/Short) for pre-emptive trade preparation.
V5 Compatibility: All code has been optimized for Pine Script version 5, utilizing the modern array and type structures for efficient Order Block and Breaker Block detection.
💡 How to Use This Indicator
This indicator works best when confirming signals across different components:
1. Identify the Trend Bias (UT Trailing Stop)
Uptrend: UT Trailing Stop line is Green (Focus only on Buy/Long opportunities).
Downtrend: UT Trailing Stop line is Red (Focus only on Sell/Short opportunities).
2. Prepare for Entry (Warning Line)
Action: When you see the "Ready" label or the price hits the Pre-Warning Line (Dotted Orange Line), this is your alert to prepare for a trend flip, or to tighten the stop on your current trade.
3. Confirm the Entry (Multi-Signals)
Look for a primary entry signal that aligns with the desired trend:
High-Conviction Entry: Wait for the UT Buy/Sell label (confirmed trend flip) AND a Combined Buy/Sell arrow (confirmed by your selected Oscillator settings).
High-Liquidity Entry: Look for a Delta Zone Box forming near an active Order Block or Breaker Block (SMC zones), and then confirm with a UT or Combined Signal.
4. Manage Risk (Trailing Stop)
Always set your initial Stop Loss (SL) either just outside the opposite Order Block or at the UT Trailing Stop level itself.
If the price closes back across the UT Trailing Stop, exit your position immediately, as the trend bias has officially shifted.
Features & Components
1. Delta Zones (Liquidity/Wick Pressure)
Identifies periods of extreme buying or selling pressure based on wick-to-body ratios and standard deviation analysis.
Plots colored pressure boxes (Buy/Sell) to highlight potential exhaustion points or institutional activity.
2. Smart Money Concepts (SMC)
Automatically detects and plots Order Blocks (OBs) and Breaker Blocks (BBs) based on confirmed Market Structure Breaks (MSBs).
Includes Chop Control logic to remove less reliable Breaker Blocks.
3. UT Bot Trailing Stop & Warning Line
UT Trailing Stop (ATR-based): Plots a dynamic trend line (Green/Red) that acts as a moving stop-loss and primary trend filter.
Ready/Warning Signals: Alerts traders (via the "Ready" label and orange lines) when the price enters a "Pre-Reversal Zone" near the Trailing Stop.
4. Multi-Indicator Confirmation (Filters)
Includes customizable signals based on the crossover/crossunder of RSI, CCI, and Stochastic indicators against configurable Overbought/Oversold levels.
Allows selection of combination signals (e.g., RSI & CCI, All Combined, etc.) for high-conviction entries.

STARKPROFITS SCALPER 2.0señales compra y venta..tendencia y estructura del mercado.se basa en tendencia

SuperEMA RSI Strategy [wjdtks255]Indicator Description and Trading Guide for “SuperEMA RSI Strategy ”
Indicator Name: SuperEMA RSI Strategy
Description
The SuperEMA RSI Strategy combines fast and slow Exponential Moving Averages (EMA) to identify key trend changes, enhanced with the Relative Strength Index (RSI) to filter momentum strength. It plots clear buy and sell signals based on EMA crossovers while highlighting trend zones with colored backgrounds for quick visual reference. This multi-timeframe compatible indicator is suitable for stocks, cryptocurrencies, and other markets.
How to Use the SuperEMA RSI Strategy
Buy Signal:
Enter a long position when the short-term EMA crosses above the long-term EMA, indicated by a green circle below the price bar. Confirm the trend with a green background and consider RSI values showing sufficient momentum (typically RSI above 50).
Sell Signal:
Enter a short position when the short-term EMA crosses below the long-term EMA, indicated by a red circle above the price bar. Confirm the bearish trend with a red background and verify momentum weakening (typically RSI below 50).
Trend Confirmation:
Use the background color-shaded zones to identify prevailing trend strength and avoid counter-trend trades.
RSI Application:
Optionally enable RSI display to avoid overbought/oversold entries by watching for levels above 70 (overbought) or below 30 (oversold).
Additional Tips
Adjust EMA and RSI parameters to suit different timeframes or asset volatility.
Combine this indicator with volume analysis and other technical tools for enhanced signal reliability.
Implement well-defined stop-loss and take-profit levels to manage risk effectively.

Fib+BOS/CHOCH+OB# ⭐ 1) **What This Indicator Does**
The indicator combines 4 major concepts:
### **1️⃣ Market Structure (Swing High/Low)**
* Detects major swing highs and lows using pivot logic
* Determines whether the market is **Bullish** or **Bearish**
### **2️⃣ BOS / CHOCH (Break of Structure / Change of Character)**
* **BOS:** continuation of trend
* **CHOCH:** early signal of trend reversal
* Only the **last 5** levels are displayed → keeps chart clean
### **3️⃣ Order Blocks (OB)**
* Detects last opposite candle before BOS/CHOCH
* Displays only **the latest 3 OB zones**
* Ideal for identifying high-probability pullbacks

MA200 Parallel ChannelDynamic MA100 Parallel Bands – Precision S/R Levels
This indicator builds a clean, parallel channel around the 100-period moving average using a fixed ±4 offset.
Because the offset mirrors the short-term MA1 fluctuations, the channel reveals highly accurate support and resistance zones that react instantly to market micro-structure.
Unlike Bollinger Bands—which expand with volatility—this tool stays perfectly parallel and trend-aligned, making breakouts and pullbacks incredibly easy to spot.
How it works:
Centerline: 100-period moving average (MA100)
Upper Band: MA100 + 4
Lower Band: MA100 – 4
MA1 used as a sensitivity reference for micro-trend behavior
Parallel structure ensures stable, predictable levels
Why it’s powerful:
The ±4 channel creates extremely precise S/R zones
Price respecting the lower band = dynamic support
Price rejecting the upper band = dynamic resistance
A clean break above or below the bands highlights strong momentum shifts
Perfect for intraday traders needing structure without noise
Perfect for:
Identifying high-probability bounce levels
Spotting early trend continuation
Confirming MA100 breakouts
Filtering weak signals and fake volatility spikes
If you want razor-sharp support & resistance levels that stay consistent across all timeframes, these MA100 parallel bands deliver exceptional clarity.
HTF BIAS FILTER🧭HTF Bias Filter Indicator: 5 in 1 indicator
Technical Overview
The Bias Filter is a comprehensive multi-timeframe tool designed to confirm directional bias using five key indicators before entering a trade. It plots higher-timeframe Moving Averages directly on the chart and provides an immediate status summary via a static dashboard.
The more confluence on the dashboard, the greater the probability of the direction of the trade.
1. 📊 Display Components
A. Plotted Lines
The indicator uses the request.security function to draw Moving Averages from higher timeframes onto your current chart:
1H EMA 21 (Purple): The 21-period Exponential Moving Average calculated on the 1-Hour (60 min) chart. Plotted using a step-line style.
4H EMA 50 (Red): The 50-period Exponential Moving Average calculated on the 4-Hour (240 min) chart. Plotted using a step-line style.
B. Directional Dashboard
A fixed-position summary table is anchored to the bottom-right corner of the chart, providing a quick glance at the current status of all five filters.
2. 🎨 Colour Logic
Each of the five indicators is assigned a colour based on its current directional signal. The more indicators that show the same colour (confluence), the stronger the signal and the higher the likelihood of a high-probability trade.
🟢 Green indicators are signaling UP/BUY (Bullish momentum or trend).
🔴 Red indicators are signaling DOWN/SELL (Bearish momentum or trend).
⚫ Gray indicators are signaling Mixed or flat directions (neutral or undecided).
Note: The dashboard's main header color is determined by a strict confluence logic (All four 4H filters must align for Green/Red), while individual indicator colors follow the simple rules above.
3. 📋 Indicator Breakdown and Logic
The dashboard provides the direction of five different filters.
3.1. Higher-Timeframe (HTF) Trend Indicators
These two signals determine the immediate slope and direction of the primary Moving Averages:
4H EMA 50:
Timeframe: 4-Hour (240 min)
Logic: Compares the current EMA value to the value two bars ago on the 4H chart.
Output: UP ↑, DOWN ↓, or FLAT ⏸
1H EMA 21:
Timeframe: 1-Hour (60 min)
Logic: Compares the current EMA value to the value two bars ago on the 1H chart.
Output: UP ↑, DOWN ↓, or FLAT ⏸
3.2. 4-Hour Confluence Filters
These three indicators provide supplementary confirmation on Volume, Price Position, and Momentum, all calculated on the 4-Hour (240 min) chart:
4H OBV (Smoothed):
Timeframe: 4-Hour (240 min)
Logic: Direction is based on the current value of the 21-bar smoothed On-Balance Volume (OBV) compared to its value nine bars ago.
Output: UP ↑, DOWN ↓, or FLAT ⏸
4H ATR DIR (EMA Proxy):
Timeframe: 4-Hour (240 min)
Logic: Determines the price position by comparing the current Close price against the 4H EMA 50.
Output: BUY 🟢 (Close > EMA 50), SELL 🔴 (Close < EMA 50), or FLAT ⏸️ (Close = EMA 50).
4H RSI (14):
Timeframe: 4-Hour (240 min)
Logic: Momentum check comparing the 14-period Relative Strength Index (RSI) value against the 50 level.
Output: BUY 🟢 (RSI > 50), SELL 🔴 (RSI < 50), or FLAT ⏸️ (RSI = 50).

3-DMA Panic Reversal [Diodato/SMI]This indicator is a market breadth tool designed to identify panic selling climaxes and potential bullish reversals. It combines Diodato's 3-DMA % Decliners with the Stochastic Momentum Index (SMI) to filter for high-probability setups.
How It Works The indicator tracks the 3-Day Moving Average of Declining Issues. When this metric spikes above 65%, it signals extreme market panic.
Signals
🟢 Green Dot (Bullish Reversal): Appears when a panic phase ends. It triggers when the 3-DMA Decliners crosses back under the 65% panic threshold, but only if the market was Oversold (SMI < 0) at some point during the panic. This "latch" logic ensures you catch the reversal even if momentum shifts slightly before the panic fully subsides.
🔴 Red Dot (Bearish/Overbought): Appears if the 3-DMA Decliners is high (> 65%) while the market is simultaneously Overbought (SMI > 40). This is a rare but powerful signal of extreme volatility or a "crash up" exhaustion.
Settings
Panic Threshold: Default 65% (Adjustable).
SMI Settings: 10, 3, 3 (Fast/Standard).
Credits Original concept by Diodato. Enhanced with SMI context for precision.

COT Net Positions OTCCOT Net Positions Indicator Description
This is a TradingView Pine Script indicator that displays Commitment of Traders (COT) data for any trading instrument.
What it does:
Fetches COT Data - Uses the TradingView COT library to retrieve official CFTC (Commodity Futures Trading Commission) data for the current symbol
Calculates Net Positions for three trader categories:
Commercial (Blue) - Large hedging institutions; represents institutional long/short positioning
Non-Commercial (Yellow) - Large speculators and hedge funds; often considered "smart money"
Retail (Red) - Small individual traders; often considered contrarian indicators
Net Position Calculation - For each category:
Takes Long Positions minus Short Positions
Plots the result on a separate panel below the price chart
Special Symbol Handling - Includes custom mappings for specific commodities:
Copper (HG) → CFTC code 085692
Brazilian Real (LBR) → CFTC code 058644
Use Cases:
Market Bias Detection - See if institutions are mostly long or short
Contrarian Trading - When retail traders are extremely positioned one way, often the market reverses
Trend Confirmation - Non-commercial positioning often aligns with established trends
Support/Resistance - Extreme COT positions can signal market turning points


BTC Risk Metric DCA Adapter (3Commas Webhook Strategy)Risk Metric DCA Adapter (3Commas Webhook Strategy) - WORK IN PROGRESS
This Pine Script strategy, originally inspired by the Risk Metric Indicator, is fundamentally engineered as an Adapter to interface with external trading bots like 3Commas via Webhooks. It calculates a dynamic market risk score and translates that score into specific dollar-cost averaging (DCA) entry levels and tiered profit-taking exits.
Key Features & Logic
Risk Metric Calculation (Credit to The Trading Parrot):
The strategy incorporates a complex, multi-timeframe Risk Metric calculation based on daily and weekly moving averages (SMA) and standard deviation (StDev). This metric aims to quantify the current market overextension or compression relative to long-term historical data. The resulting score dictates the level of conviction for a new trade.
Tiered DCA Entry Sizing:
The strategy defines three distinct Buy Levels (L1, L2, L3) corresponding to increasingly favorable (lower) Risk Metric scores.
L1 (Base): Risk is moderate, initiating the minimum defined trade amount.
L2 (Scaled): Risk is low, initiating L1 amount + L2 amount.
L3 (Aggressive): Risk is very low, initiating L1 + L2 + L3 amounts.
Tiered Profit-Taking Exits:
The strategy implements a staggered, partial profit-taking approach based on the Risk Metric rising:
Sell L1 & L2: Closes a percentage of the current position when the Risk Metric reaches defined high thresholds, locking in partial profits.
Sell L3 (Full Exit): Closes the remaining position when the Risk Metric reaches the highest defined threshold.
The Adapter Function (Webhook Integration)
This script is unique because it uses the Pine Script strategy() function to trigger Order Fills, which are necessary to access powerful placeholders in the TradingView alert system.
Trigger Type: The alert must be set to trigger on Any order fill.
Dynamic Webhook Data: Instead of using fixed alert() commands, the strategy generates dynamic labels (e.g., BUY_ENTRY_L3_USD_1000 or SELL_L1_PCT_25) using the strategy.entry and strategy.close commands.
Data Transfer: The alert message then uses the placeholder {{strategy.order.comment}} to pass these dynamic labels to the 3Commas bot, allowing the bot to execute the precise action (e.g., start_deal_with_volume_in_quote_currency or close_deal_at_market_percentage).
Full Strategy Webhook payload
{
"secret": "YOUR_3COMMAS_SECRET_KEY",
"max_lag": "300",
"timestamp": "{{timenow}}",
"trigger_price": "{{close}}",
"tv_exchange": "{{exchange}}",
"tv_instrument": "{{ticker}}",
"action": "{{strategy.order.action}}",
"bot_uuid": "YOUR_BOT_UUID",
"strategy_info": {
"market_position": "{{strategy.market_position}}",
"market_position_size": "{{strategy.market_position_size}}",
"prev_market_position": "{{strategy.prev_market_position}}",
"prev_market_position_size": "{{strategy.prev_market_position_size}}"
},
"order": {
"amount": "{{strategy.order.contracts}}",
"currency_type": "base",
"comment": "{{strategy.order.comment}}"
}
}
Disclaimer: This script is an adapter tool and does not guarantee profit. Trading requires manual configuration of risk settings, bot parameters, and adherence to platform-specific setup instructions.


Chỉ báo Engulfing (Lọc EMA & K%)chỉ báo engulfing nhằm tìm kiếm tín hiệu đảo chiều với hệ số phủ thân nến là K%

Mars Signals - Ultimate Institutional Suite v3.0(Joker)Comprehensive Trading Manual
Mars Signals – Ultimate Institutional Suite v3.0 (Joker)
## Chapter 1 – Philosophy & System Architecture
This script is not a simple “buy/sell” indicator.
Mars Signals – UIS v3.0 (Joker) is designed as an institutional-style analytical assistant that layers several methodologies into a single, coherent framework.
The system is built on four core pillars:
1. Smart Money Concepts (SMC)
- Detection of Order Blocks (professional demand/supply zones).
- Detection of Fair Value Gaps (FVGs) (price imbalances).
2. Smart DCA Strategy
- Combination of RSI and Bollinger Bands
- Identifies statistically discounted zones for scaling into spot positions or exiting shorts.
3. Volume Profile (Visible Range Simulation)
- Distribution of volume by price, not by time.
- Identification of POC (Point of Control) and high-/low-volume areas.
4. Wyckoff Helper – Spring
- Detection of bear traps, liquidity grabs, and sharp bullish reversals.
All four pillars feed into a Confluence Engine (Scoring System).
The final output is presented in the Dashboard, with a clear, human-readable signal:
- STRONG LONG 🚀
- WEAK LONG ↗
- NEUTRAL / WAIT
- WEAK SHORT ↘
- STRONG SHORT 🩸
This allows the trader to see *how many* and *which* layers of the system support a bullish or bearish bias at any given time.
## Chapter 2 – Settings Overview
### 2.1 General & Dashboard Group
- Show Dashboard Panel (`show_dash`)
Turns the dashboard table in the corner of the chart ON/OFF.
- Show Signal Recommendation (`show_rec`)
- If enabled, the textual signal (STRONG LONG, WEAK SHORT, etc.) is displayed.
- If disabled, you only see feature status (ON/OFF) and the current price.
- Dashboard Position (`dash_pos`)
Determines where the dashboard appears on the chart:
- `Top Right`
- `Bottom Right`
- `Top Left`
### 2.2 Smart Money (SMC) Group
- Enable SMC Strategy (`show_smc`)
Globally enables or disables the Order Block and FVG logic.
- Order Block Pivot Lookback (`ob_period`)
Main parameter for detecting key pivot highs/lows (swing points).
- Default value: 5
- Concept:
A bar is considered a pivot low if its low is lower than the lows of the previous 5 and the next 5 bars.
Similarly, a pivot high has a high higher than the previous 5 and the next 5 bars.
These pivots are used as anchors for Order Blocks.
- Increasing `ob_period`:
- Fewer levels.
- But levels tend to be more significant and reliable.
- In highly volatile markets (major news, war events, FOMC, etc.),
using values 7–10 is recommended to filter out weak levels.
- Show Fair Value Gaps (`show_fvg`)
Enables/disables the drawing of FVG zones (imbalances).
- Bullish OB Color (`c_ob_bull`)
- Color of Bullish Order Blocks (Demand Zones).
- Default: semi-transparent green (transparency ≈ 80).
- Bearish OB Color (`c_ob_bear`)
- Color of Bearish Order Blocks (Supply Zones).
- Default: semi-transparent red.
- Bullish FVG Color (`c_fvg_bull`)
- Color of Bullish FVG (upward imbalance), typically yellow.
- Bearish FVG Color (`c_fvg_bear`)
- Color of Bearish FVG (downward imbalance), typically purple.
### 2.3 Smart DCA Strategy Group
- Enable DCA Zones (`show_dca`)
Enables the Smart DCA logic and visual labels.
- RSI Length (`rsi_len`)
Lookback period for RSI (default: 14).
- Shorter → more sensitive, more noise.
- Longer → fewer signals, higher reliability.
- Bollinger Bands Length (`bb_len`)
Moving average period for Bollinger Bands (default: 20).
- BB Multiplier (`bb_mult`)
Standard deviation multiplier for Bollinger Bands (default: 2.0).
- For extremely volatile markets, values like 2.5–3.0 can be used so that only extreme deviations trigger a DCA signal.
### 2.4 Volume Profile (Visible Range Sim) Group
- Show Volume Profile (`show_vp`)
Enables the simulated Volume Profile bars on the right side of the chart.
- Volume Lookback Bars (`vp_lookback`)
Number of bars used to compute the Volume Profile (default: 150).
- Higher values → broader historical context, heavier computation.
- Row Count (`vp_rows`)
Number of vertical price segments (rows) to divide the total price range into (default: 30).
- Width (%) (`vp_width`)
Relative width of each volume bar as a percentage.
In the code, bar widths are scaled relative to the row with the maximum volume.
> Technical note: Volume Profile calculations are executed only on the last bar (`barstate.islast`) to keep the script performant even on higher timeframes.
### 2.5 Wyckoff Helper Group
- Show Wyckoff Events (`show_wyc`)
Enables detection and plotting of Wyckoff Spring events.
- Volume MA Length (`vol_ma_len`)
Length of the moving average on volume.
A bar is considered to have Ultra Volume if its volume is more than 2× the volume MA.
## Chapter 3 – Smart Money Strategy (Order Blocks & FVG)
### 3.1 What Is an Order Block?
An Order Block (OB) represents the footprint of large institutional orders:
- Bullish Order Block (Demand Zone)
The last selling region (bearish candle/cluster) before a strong upward move.
- Bearish Order Block (Supply Zone)
The last buying region (bullish candle/cluster) before a strong downward move.
Institutions and large players place heavy orders in these regions. Typical price behavior:
- Price moves away from the zone.
- Later returns to the same zone to fill unfilled orders.
- Then continues the larger trend.
In the script:
- If `pl` (pivot low) forms → a Bullish OB is created.
- If `ph` (pivot high) forms → a Bearish OB is created.
The box is drawn:
- From `bar_index ` to `bar_index`.
- Between `low ` and `high `.
- `extend=extend.right` extends the OB into the future, so it acts as a dynamic support/resistance zone.
- Only the last 4 OB boxes are kept to avoid clutter.
### 3.2 Order Block Color Guide
- Semi-transparent Green (`c_ob_bull`)
- Represents a Bullish Order Block (Demand Zone).
- Interpretation: a price region with a high probability of bullish reaction.
- Semi-transparent Red (`c_ob_bear`)
- Represents a Bearish Order Block (Supply Zone).
- Interpretation: a price region with a high probability of bearish reaction.
Overlap (Multiple OBs in the Same Area)
When two or more Order Blocks overlap:
- The shared area appears visually denser/stronger.
- This suggests higher order density.
- Such zones can be treated as high-priority levels for entries, exits, and stop-loss placement.
### 3.3 Demand/Supply Logic in the Scoring Engine
is_in_demand = low <= ta.lowest(low, 20)
is_in_supply = high >= ta.highest(high, 20)
- If current price is near the lowest lows of the last 20 bars, it is considered in a Demand Zone → positive impact on score.
- If current price is near the highest highs of the last 20 bars, it is considered in a Supply Zone → negative impact on score.
This logic complements Order Blocks and helps the Dashboard distinguish whether:
- Market is currently in a statistically cheap (long-friendly) area, or
- In a statistically expensive (short-friendly) area.
### 3.4 Fair Value Gaps (FVG)
#### Concept
When the market moves aggressively:
- Some price levels are skipped and never traded.
- A gap between wicks/shadows of consecutive candles appears.
- These regions are called Fair Value Gaps (FVGs) or Imbalances.
The market generally “dislikes” imbalance and often:
- Returns to these zones in the future.
- Fills the gap (rebalance).
- Then resumes its dominant direction.
#### Implementation in the Code
Bullish FVG (Yellow)
fvg_bull_cond = show_smc and show_fvg and low > high and close > high
if fvg_bull_cond
box.new(bar_index , high , bar_index, low, ...)
Core condition:
`low > high ` → the current low is above the high of two bars ago; the space between them is an untraded gap.
Bearish FVG (Purple)
fvg_bear_cond = show_smc and show_fvg and high < low and close < low
if fvg_bear_cond
box.new(bar_index , low , bar_index, high, ...)
Core condition:
`high < low ` → the current high is below the low of two bars ago; again a price gap exists.
#### FVG Color Guide
- Transparent Yellow (`c_fvg_bull`) – Bullish FVG
Often acts like a magnet for price:
- Price tends to retrace into this zone,
- Fill the imbalance,
- And then continue higher.
- Transparent Purple (`c_fvg_bear`) – Bearish FVG
Price tends to:
- Retrace upward into the purple area,
- Fill the imbalance,
- And then resume downward movement.
#### Trading with FVGs
- FVGs are *not* standalone entry signals.
They are best used as:
- Targets (take-profit zones), or
- Reaction areas where you expect a pause or reversal.
Examples:
- If you are long, a bearish FVG above is often an excellent take-profit zone.
- If you are short, a bullish FVG below is often a good cover/exit zone.
### 3.5 Core SMC Trading Templates
#### Reversal Long
1. Price trades down into a green Order Block (Demand Zone).
2. A bullish confirmation candle (Close > Open) forms inside or just above the OB.
3. If this zone is close to or aligned with a bullish FVG (yellow), the signal is reinforced.
4. Entry:
- At the close of the confirmation candle, or
- Using a limit order near the upper boundary of the OB.
5. Stop-loss:
- Slightly below the OB.
- If the OB is broken decisively and price consolidates below it, the zone loses validity.
6. Targets:
- The next FVG,
- Or the next red Order Block (Supply Zone) above.
#### Reversal Short
The mirror scenario:
- Price rallies into a red Order Block (Supply).
- A bearish confirmation candle forms (Close < Open).
- FVG/premium structure above can act as a confluence.
- Stop-loss goes above the OB.
- Targets: lower FVGs or subsequent green OBs below.
## Chapter 4 – Smart DCA Strategy (RSI + Bollinger Bands)
### 4.1 Smart DCA Concept
- Classic DCA = buying at fixed time intervals regardless of price.
- Smart DCA = scaling in only when:
- Price is statistically cheaper than usual, and
- The market is in a clear oversold condition.
Code logic:
rsi_val = ta.rsi(close, rsi_len)
= ta.bb(close, bb_len, bb_mult)
dca_buy = show_dca and rsi_val < 30 and close < bb_lower
dca_sell = show_dca and rsi_val > 70 and close > bb_upper
Conditions:
- DCA Buy – Smart Scale-In Zone
- RSI < 30 → oversold.
- Close < lower Bollinger Band → price has broken below its typical volatility envelope.
- DCA Sell – Overbought/Distribution Zone
- RSI > 70 → overbought.
- Close > upper Bollinger Band → price is extended far above the mean.
### 4.2 Visual Representation on the Chart
- Green “DCA” Label Below Candle
- Shape: `labelup`.
- Color: lime background, white text.
- Meaning: statistically attractive level for laddered spot entries or short exits.
- Red “SELL” Label Above Candle
- Warning that the market is in an extended, overbought condition.
- Suitable for profit-taking on longs or considering short entries (with proper confluence and risk management).
- Light Green Background (`bgcolor`)
- When `dca_buy` is true, the candle background turns very light green (high transparency).
- This helps visually identify DCA Zones across the chart at a glance.
### 4.3 Practical Use in Trading
#### Spot Trading
Used to build a better average entry price:
- Every time a DCA label appears, allocate a fixed portion of capital (e.g., 2–5%).
- Combining DCA signals with:
- Green OBs (Demand Zones), and/or
- The Volume Profile POC
makes the zone structurally more important.
#### Futures Trading
- Longs
- Use DCA Buy signals as low-risk zones for opening or adding to longs when:
- Price is inside a green OB, or
- The Dashboard already leans LONG.
- Shorts
- Use DCA Sell signals as:
- Exit zones for longs, or
- Areas to initiate shorts with stops above structural highs.
## Chapter 5 – Volume Profile (Visible Range Simulation)
### 5.1 Concept
Traditional volume (histogram under the chart) shows volume over time.
Volume Profile shows volume by price level:
- At which prices has the highest trading activity occurred?
- Where did buyers and sellers agree the most (High Volume Nodes – HVNs)?
- Where did price move quickly due to low participation (Low Volume Nodes – LVNs)?
### 5.2 Implementation in the Script
Executed only when `show_vp` is enabled and on the last bar:
1. The last `vp_lookback` bars (default 150) are processed.
2. The minimum low and maximum high over this window define the price range.
3. This price range is divided into `vp_rows` segments (e.g., 30 rows).
4. For each row:
- All bars are scanned.
- If the mid-price `(high + low ) / 2` falls inside a row, that bar’s volume is added to the row total.
5. The row with the greatest volume is stored as `max_vol_idx` (the POC row).
6. For each row, a volume box is drawn on the right side of the chart.
### 5.3 Color Scheme
- Semi-transparent Orange
- The row with the maximum volume – the Point of Control (POC).
- Represents the strongest support/resistance level from a volume perspective.
- Semi-transparent Blue
- Other volume rows.
- The taller the bar → the higher the volume → the stronger the interest at that price band.
### 5.4 Trading Applications
- If price is above POC and retraces back into it:
→ POC often acts as support, suitable for long setups.
- If price is below POC and rallies into it:
→ POC often acts as resistance, suitable for short setups or profit-taking.
HVNs (Tall Blue Bars)
- Represent areas of equilibrium where the market has spent time and traded heavily.
- Price tends to consolidate here before choosing a direction.
LVNs (Short or Nearly Empty Bars)
- Represent low participation zones.
- Price often moves quickly through these areas – useful for targeting fast moves.
## Chapter 6 – Wyckoff Helper – Spring
### 6.1 Spring Concept
In the Wyckoff framework:
- A Spring is a false break of support.
- The market briefly trades below a well-defined support level, triggers stop losses,
then sharply reverses upward as institutional buyers absorb liquidity.
This movement:
- Clears out weak hands (retail sellers).
- Provides large players with liquidity to enter long positions.
- Often initiates a new uptrend.
### 6.2 Code Logic
Conditions for a Spring:
1. The current low is lower than the lowest low of the previous 50 bars
→ apparent break of a long-standing support.
2. The bar closes bullish (Close > Open)
→ the breakdown was rejected.
3. Volume is significantly elevated:
→ `volume > 2 × volume_MA` (Ultra Volume).
When all conditions are met and `show_wyc` is enabled:
- A pink diamond is plotted below the bar,
- With the label “Spring” – one of the strongest long signals in this system.
### 6.3 Trading Use
- After a valid Spring, markets frequently enter a meaningful bullish phase.
- The highest quality setups occur when:
- The Spring forms inside a green Order Block, and
- Near or on the Volume Profile POC.
Entries:
- At the close of the Spring bar, or
- On the first pullback into the mid-range of the Spring candle.
Stop-loss:
- Slightly below the Spring’s lowest point (wick low plus a small buffer).
## Chapter 7 – Confluence Engine & Dashboard
### 7.1 Scoring Logic
For each bar, the script:
1. Resets `score` to 0.
2. Adjusts the score based on different signals.
SMC Contribution
if show_smc
if is_in_demand
score += 1
if is_in_supply
score -= 1
- Being in Demand → `+1`
- Being in Supply → `-1`
DCA Contribution
if show_dca
if dca_buy
score += 2
if dca_sell
score -= 2
- DCA Buy → `+2` (strong, statistically driven long signal)
- DCA Sell → `-2`
Wyckoff Spring Contribution
if show_wyc
if wyc_spring
score += 2
- Spring → `+2` (entry of strong money)
### 7.2 Mapping Score to Dashboard Signal
- score ≥ 2 → STRONG LONG 🚀
Multiple bullish conditions aligned.
- score = 1 → WEAK LONG ↗
Some bullish bias, but only one layer clearly positive.
- score = 0 → NEUTRAL / WAIT
Rough balance between buying and selling forces; staying flat is usually preferable.
- score = -1 → WEAK SHORT ↘
Mild bearish bias, suited for cautious or short-term plays.
- score ≤ -2 → STRONG SHORT 🩸
Convergence of several bearish signals.
### 7.3 Dashboard Structure
The dashboard is a two-column table:
- Row 0
- Column 0: `"Mars Signals"` – black background, white text.
- Column 1: `"UIS v3.0"` – black background, yellow text.
- Row 1
- Column 0: `"Price:"` (light grey background).
- Column 1: current closing price (`close`) with a semi-transparent blue background.
- Row 2
- Column 0: `"SMC:"`
- Column 1:
- `"ON"` (green) if `show_smc = true`
- `"OFF"` (grey) otherwise.
- Row 3
- Column 0: `"DCA:"`
- Column 1:
- `"ON"` (green) if `show_dca = true`
- `"OFF"` (grey) otherwise.
- Row 4
- Column 0: `"Signal:"`
- Column 1: signal text (`status_txt`) with background color `status_col`
(green, red, teal, maroon, etc.)
- If `show_rec = false`, these cells are cleared.
## Chapter 8 – Visual Legend (Colors, Shapes & Actions)
For quick reading inside TradingView, the visual elements are described line by line instead of a table.
Chart Element: Green Box
Color / Shape: Transparent green rectangle
Core Meaning: Bullish Order Block (Demand Zone)
Suggested Trader Response: Look for longs, Smart DCA adds, closing or reducing shorts.
Chart Element: Red Box
Color / Shape: Transparent red rectangle
Core Meaning: Bearish Order Block (Supply Zone)
Suggested Trader Response: Look for shorts, or take profit on existing longs.
Chart Element: Yellow Area
Color / Shape: Transparent yellow zone
Core Meaning: Bullish FVG / upside imbalance
Suggested Trader Response: Short take-profit zone or expected rebalance area.
Chart Element: Purple Area
Color / Shape: Transparent purple zone
Core Meaning: Bearish FVG / downside imbalance
Suggested Trader Response: Long take-profit zone or temporary supply region.
Chart Element: Green "DCA" Label
Color / Shape: Green label with white text, plotted below the candle
Core Meaning: Smart ladder-in buy zone, DCA buy opportunity
Suggested Trader Response: Spot DCA entry, partial short exit.
Chart Element: Red "SELL" Label
Color / Shape: Red label with white text, plotted above the candle
Core Meaning: Overbought / distribution zone
Suggested Trader Response: Take profit on longs, consider initiating shorts.
Chart Element: Light Green Background (bgcolor)
Color / Shape: Very transparent light-green background behind bars
Core Meaning: Active DCA Buy zone
Suggested Trader Response: Treat as a discount zone on the chart.
Chart Element: Orange Bar on Right
Color / Shape: Transparent orange horizontal bar in the volume profile
Core Meaning: POC – price with highest traded volume
Suggested Trader Response: Strong support or resistance; key reference level.
Chart Element: Blue Bars on Right
Color / Shape: Transparent blue horizontal bars in the volume profile
Core Meaning: Other volume levels, showing high-volume and low-volume nodes
Suggested Trader Response: Use to identify balance zones (HVN) and fast-move corridors (LVN).
Chart Element: Pink "Spring" Diamond
Color / Shape: Pink diamond with white text below the candle
Core Meaning: Wyckoff Spring – liquidity grab and potential major bullish reversal
Suggested Trader Response: One of the strongest long signals in the suite; look for high-quality long setups with tight risk.
Chart Element: STRONG LONG in Dashboard
Color / Shape: Green background, white text in the Signal row
Core Meaning: Multiple bullish layers in confluence
Suggested Trader Response: Consider initiating or increasing longs with strict risk management.
Chart Element: STRONG SHORT in Dashboard
Color / Shape: Red background, white text in the Signal row
Core Meaning: Multiple bearish layers in confluence
Suggested Trader Response: Consider initiating or increasing shorts with a logical, well-placed stop.
## Chapter 9 – Timeframe-Based Trading Playbook
### 9.1 Timeframe Selection
- Scalping
- Timeframes: 1M, 5M, 15M
- Objective: fast intraday moves (minutes to a few hours).
- Recommendation: focus on SMC + Wyckoff.
Smart DCA on very low timeframes may introduce excessive noise.
- Day Trading
- Timeframes: 15M, 1H, 4H
- Provides a good balance between signal quality and frequency.
- Recommendation: use the full stack – SMC + DCA + Volume Profile + Wyckoff + Dashboard.
- Swing Trading & Position Investing
- Timeframes: Daily, Weekly
- Emphasis on Smart DCA + Volume Profile.
- SMC and Wyckoff are used mainly to fine-tune swing entries within larger trends.
### 9.2 Scenario A – Scalping Long
Example: 5-Minute Chart
1. Price is declining into a green OB (Bullish Demand).
2. A candle with a long lower wick and bullish close (Pin Bar / Rejection) forms inside the OB.
3. A Spring diamond appears below the same candle → very strong confluence.
4. The Dashboard shows at least WEAK LONG ↗, ideally STRONG LONG 🚀.
5. Entry:
- On the close of the confirmation candle, or
- On the first pullback into the mid-range of that candle.
6. Stop-loss:
- Slightly below the OB.
7. Targets:
- Nearby bearish FVG above, and/or
- The next red OB.
### 9.3 Scenario B – Day-Trading Short
Recommended Timeframes: 1H or 4H
1. The market completes a strong impulsive move upward.
2. Price enters a red Order Block (Supply).
3. In the same zone, a purple FVG appears or remains unfilled.
4. On a lower timeframe (e.g., 15M), RSI enters overbought territory and a DCA Sell signal appears.
5. The main timeframe Dashboard (1H) shows WEAK SHORT ↘ or STRONG SHORT 🩸.
Trade Plan
- Open a short near the upper boundary of the red OB.
- Place the stop above the OB or above the last swing high.
- Targets:
- A yellow FVG lower on the chart, and/or
- The next green OB (Demand) below.
### 9.4 Scenario C – Swing / Investment with Smart DCA
Timeframes: Daily / Weekly
1. On the daily or weekly chart, each time a green “DCA” label appears:
- Allocate a fixed fraction of your capital (e.g., 3–5%) to that asset.
2. Check whether this DCA zone aligns with the orange POC of the Volume Profile:
- If yes → the quality of the entry zone is significantly higher.
3. If the DCA signal sits inside a daily green OB, the probability of a medium-term bottom increases.
4. Always build the position laddered, never all-in at a single price.
Exits for investors:
- Near weekly red OBs or large purple FVG zones.
- Ideally via partial profit-taking rather than closing 100% at once.
### 9.5 Case Study 1 – BTCUSDT (15-Minute)
- Context: Price has sold off down towards 65,000 USD.
- A green OB had previously formed at that level.
- Near the lower boundary of this OB, a partially filled yellow FVG is present.
- As price returns to this region, a Spring appears.
- The Dashboard shifts from NEUTRAL / WAIT to WEAK LONG ↗.
Plan
- Enter a long near the OB low.
- Place stop below the Spring low.
- First target: a purple FVG around 66,200.
- Second (optional) target: the first red OB above that level.
### 9.6 Case Study 2 – Meme Coin (PEPE – 4H)
- After a strong pump, price enters a corrective phase.
- On the 4H chart, RSI drops below 30; price breaks below the lower Bollinger Band → a DCA label prints.
- The Volume Profile shows the POC at approximately the same level.
- The Dashboard displays STRONG LONG 🚀.
Plan
- Execute laddered buys in the combined DCA + POC zone.
- Place a protective stop below the last significant swing low.
- Target: an expected 20–30% upside move towards the next red OB or purple FVG.
## Chapter 10 – Risk Management, Psychology & Advanced Tuning
### 10.1 Risk Management
No signal, regardless of its strength, replaces risk control.
Recommendations:
- In futures, do not expose more than 1–3% of account equity to risk per trade.
- Adjust leverage to the volatility of the instrument (lower leverage for highly volatile altcoins).
- Place stop-losses in zones where the idea is clearly invalidated:
- Below/above the relevant Order Block or Spring, not randomly in the middle of the structure.
### 10.2 Market-Specific Parameter Tuning
- Calmer Markets (e.g., major FX pairs)
- `ob_period`: 3–5.
- `bb_mult`: 2.0 is usually sufficient.
- Highly Volatile Markets (Crypto, news-driven assets)
- `ob_period`: 7–10 to highlight only the most robust OBs.
- `bb_mult`: 2.5–3.0 so that only extreme deviations trigger DCA.
- `vol_ma_len`: increase (e.g., to ~30) so that Spring triggers only on truly exceptional
volume spikes.
### 10.3 Trading Psychology
- STRONG LONG 🚀 does not mean “risk-free”.
It means the probability of a successful long, given the model’s logic, is higher than average.
- Treat Mars Signals as a confirmation and context system, not a full replacement for your own decision-making.
- Example of disciplined thinking:
- The Dashboard prints STRONG LONG,
- But price is simultaneously testing a multi-month macro resistance or a major negative news event is imminent,
- In such cases, trade smaller, widen stops appropriately, or skip the trade.
## Chapter 11 – Technical Notes & FAQ
### 11.1 Does the Script Repaint?
- Order Blocks and Springs are based on completed pivot structures and confirmed candles.
- Until a pivot is confirmed, an OB does not exist; after confirmation, behavior is stable under classic SMC assumptions.
- The script is designed to be structurally consistent rather than repainting signals arbitrarily.
### 11.2 Computational Load of Volume Profile
- On the last bar, the script processes up to `vp_lookback` bars × `vp_rows` rows.
- On very low timeframes with heavy zooming, this can become demanding.
- If you experience performance issues:
- Reduce `vp_lookback` or `vp_rows`, or
- Temporarily disable Volume Profile (`show_vp = false`).
### 11.3 Multi-Timeframe Behavior
- This version of the script is not internally multi-timeframe.
All logic (OB, DCA, Spring, Volume Profile) is computed on the active timeframe only.
- Practical workflow:
- Analyze overall structure and key zones on higher timeframes (4H / Daily).
- Use lower timeframes (15M / 1H) with the same tool for timing entries and exits.
## Conclusion
Mars Signals – Ultimate Institutional Suite v3.0 (Joker) is a multi-layer trading framework that unifies:
- Price structure (Order Blocks & FVG),
- Statistical behavior (Smart DCA via RSI + Bollinger),
- Volume distribution by price (Volume Profile with POC, HVN, LVN),
- Liquidity events (Wyckoff Spring),
into a single, coherent system driven by a transparent Confluence Scoring Engine.
The final output is presented in clear, actionable language:
> STRONG LONG / WEAK LONG / NEUTRAL / WEAK SHORT / STRONG SHORT
The system is designed to support professional decision-making, not to replace it.
Used together with strict risk management and disciplined execution,
Mars Signals – UIS v3.0 (Joker) can serve as a central reference manual and operational guide
for your trading workflow, from scalping to swing and investment positioning.

Coin Jin Multi SMA+ BB+ SMA forecast Ver2.02This script provides a complete trend-analysis system based on the
5 / 20 / 60 / 112 / 224 / 448 / 896 SMAs.
It precisely detects bullish/bearish alignment and automatically identifies
12 advanced trend-shift signals (Start, End, and Reversal).
Key Features:
● 9 SMA lines (including custom X1 & X2)
Each SMA supports custom color, width, and style (Line/Step/Circles).
● Bollinger Bands with customizable options
Fully adjustable length, source, width, style, fill transparency, and more.
● SMA Forecast (curved projection)
– Slope computed via linear regression
– Predicts up to 30 future bars
– Forced dotted style ensures visibility at all zoom levels
● 12 Advanced Trend Signals (alertcondition)
Automatically detects:
Start of full alignment (with/without SMA 896)
End of alignment
Bull ↔ Bear transitions
Perfect for momentum trading, trend-following, reversal detection, or automated alert systems.
● Labeling last value of each SMA
Each SMA prints a label such as "5", “20”, “60”, “896”, or custom lengths at the latest bar.
이 스크립트는 5 / 20 / 60 / 112 / 224 / 448 / 896 이동평균선을 기반으로
정배열·역배열 상태를 정밀하게 분석하고,
총 12가지 고급 추세 신호(시작·종료·전환) 를 자동으로 감지하는 통합 추세 분석 도구입니다.
주요 기능:
● 9개의 SMA 표시 (커스텀 X1, X2 포함)
각 SMA는 색상·굵기·형태(Line/Step/Circle)를 개별 설정할 수 있습니다.
● 볼린저밴드 표시 및 채우기 옵션
BB 길이, 소스, 타입, 두께, 투명도 등을 자유롭게 조절 가능.
● SMA Forecast (미래 방향 곡선 예측)
– 기울기 기반 선형회귀 슬로프 계산
– 곡선 형태로 미래 30봉까지 예측
– 점선(Dotted) 강제 적용으로 어떤 배율에서도 선명하게 표시
● 12가지 고급 추세 신호(alertcondition)
정배열·역배열의
Start (처음 완성될 때)
End (깨질 때)
Switch (전환)
을 모두 자동 탐지하여 트레이딩뷰 알림으로 받을 수 있음.
● SMA 마지막 가격 라벨 표시
각 SMA 끝 지점에 “5 / 20 / 60 / ... / 896” 식으로 라벨 표시.

FOX ScreenerFOX Screener is a multi-indicator market scanner designed to analyze up to 10 symbols simultaneously and display their technical conditions in a clean, real-time table. It helps traders quickly identify bullish, bearish, and neutral setups based on a combined signal system.
The screener evaluates each symbol using:
RSI (Overbought/Oversold levels)
MACD (Momentum direction)
EMA Difference (Short–Long trend bias)
Bollinger Bands (Volatility-based reversal zones)
Price, High, Low (For quick reference)
Each indicator generates its own BUY/SELL/NEUTRAL reading, and the script consolidates them into a Total Signal with color-coded highlighting:
BUY when bullish signals dominate
SELL when bearish signals dominate
NEUTRAL when signals are mixed
Disclaimer:
The information provided is for educational and informational purposes only. It does not constitute financial or investment advice. Trading and investing in stocks involves risk, including the possible loss of capital. Any decisions to buy, sell, or hold securities are the sole responsibility of the reader. Past performance is not indicative of future results. Always do your own research and, if necessary, consult with a licensed financial advisor before making investment decisions.

Risk-Managed StrategyRisk-Managed Strategy is a complete algorithmic trading framework that blends multiple technical systems—RSI, MACD, EMA crossover, Bollinger Bands, and SuperTrend—into a unified signal engine.
The script dynamically calculates position size based on capital, risk percentage, ATR-based stop loss, and reward-ratio targets.
It features:
-Multi-indicator signal voting (BUY / SELL / NEUTRAL)
- Dynamic capital tracking across trades
- Automatic position sizing based on risk amount
- Auto-generated Stop Loss and Take Profit using recent highs/lows
- On-chart SL, TP, and CMP plotting for clarity
This strategy is designed for traders who want a professional, rule-based system that balances accuracy, risk control, and automation.
Disclaimer:
The information provided is for educational and informational purposes only. It does not constitute financial or investment advice. Trading and investing in stocks involves risk, including the possible loss of capital. Any decisions to buy, sell, or hold securities are the sole responsibility of the reader. Past performance is not indicative of future results. Always do your own research and, if necessary, consult with a licensed financial advisor before making investment decisions.
