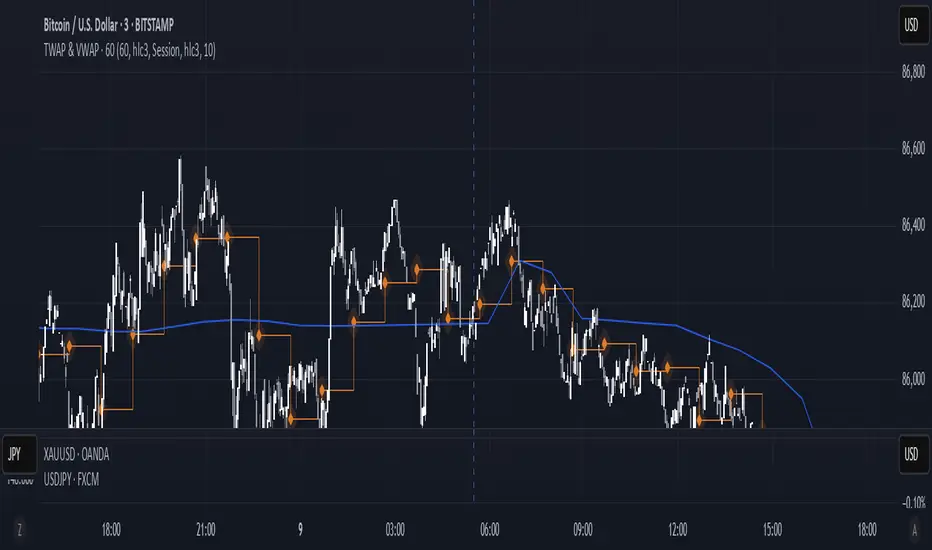
TWAP & VWAP CombinedThis script integrates Time Weighted Average Price (TWAP) and Volume Weighted Average Price (VWAP) into a single TradingView indicator, allowing traders to analyze both price-weighted and volume-weighted trends simultaneously.
Features:
TWAP Calculation:
Computes the average price over a specified anchor period (e.g., daily).
Resets and recalculates TWAP when the anchor period changes.
Uses the OHLC4 (Open, High, Low, Close average) as the default price source.
VWAP Calculation:
Computes the VWAP based on the selected anchor period (Session, Week, Month, etc.).
Allows the option to hide VWAP when the timeframe is 1D or higher.
Uses HLC3 (High, Low, Close average) as the default source.
Dynamically resets VWAP at the start of a new period.
Customization Options:
Users can modify the source price for TWAP and VWAP calculations.
Adjustable offsets for both indicators to shift plots forward or backward.
Ability to select different VWAP anchor periods, including earnings, dividends, and splits.
Error Handling:
Displays an error message if volume data is missing, ensuring VWAP functions correctly.
Индикаторы ширины рынка
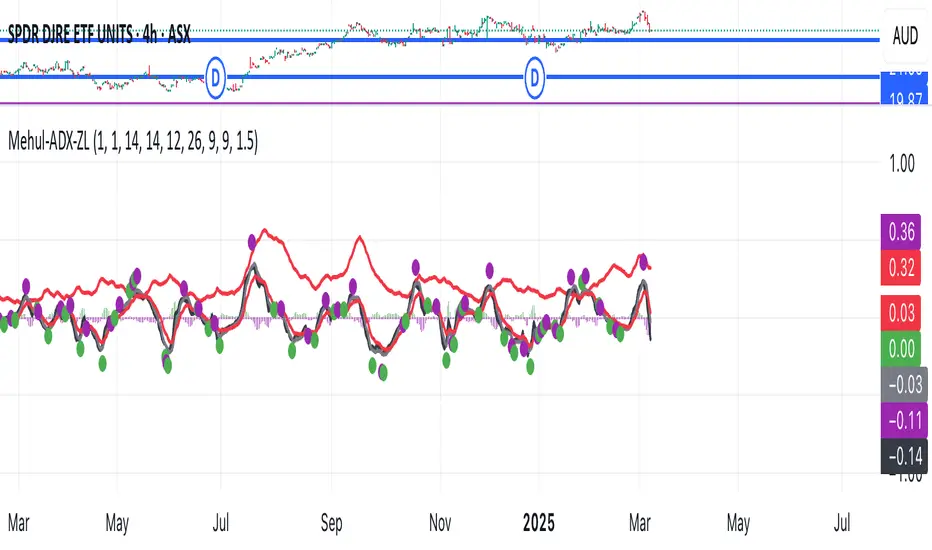
Mehul - ADX Zero LagThis script combines two popular technical indicators into a single visualization:
1. **Average Directional Index (ADX)**:
- Measures trend strength on a scale from 0-100 (now normalized to 0-1 by dividing by 100)
- Displayed as a red line
- Adjustable smoothing and length parameters
2. **Zero Lag MACD (Modified Moving Average Convergence Divergence)**:
- An enhanced version of the traditional MACD with reduced lag
- Shows the relationship between fast and slow moving averages
- Main components include:
- MACD line (black)
- Signal line (gray)
- Histogram (green for positive, purple for negative)
- EMA of the MACD line (red)
- Optional crossing dots
Key features of the combined indicator:
- **Scale Adjustment**: Both indicators can be scaled independently (adxScale and macdScale parameters)
- **Visibility Toggles**: Each indicator can be shown or hidden
- **Advanced Customization**: Parameters for both indicators can be fine-tuned
- **Algorithm Selection**: Option to choose between the "Glaz" algorithm or the "real" zero lag algorithm
- **Display Options**: Toggles for visualization elements like crossing dots
The most significant technical aspect is that both indicators are displayed in the same pane with compatible scaling, achieved by normalizing the ADX values and applying user-defined scale factors to both indicators.
This combined indicator is designed to give traders a comprehensive view of both trend strength (from ADX) and momentum/direction (from Zero Lag MACD) in a single, easy-to-read visualization.
Cumulative New Highs - New Lows IndicatorThis indicator is designed to track market momentum by calculating and plotting the cumulative sum of 52 weeks High-Low for different indices, alongside a customizable moving average.
Index Selection:
Users can choose from multiple indices, including:
Total Stock Market (default)
NYSE Composite
Nasdaq Composite
S&P 500
Nasdaq 100
Russell 2000
Moving Average Customization:
The script allows you to select between a Simple Moving Average (SMA) or an Exponential Moving Average (EMA) for smoothing the cumulative data. The window length of the moving average is also adjustable, letting you tailor the sensitivity of the trend analysis.
Dynamic Background Plotting:
With the background plot option enabled, the indicator changes the chart's background color dynamically:
Green: When the cumulative sum is above its moving average, suggesting bullish momentum.
Red: When it is below the moving average, indicating bearish conditions.
Visual Representation:
Two key lines are plotted:
Cumulative Index Line: Displayed in a subtle blue, representing the aggregated market movement.
Moving Average Line: Shown in an orange tone, offering a smoothed perspective that aids in identifying trend shifts.
Inspiration:
I took inspiration from the indicator made by YoxTrades (I can't put links, but you can check their profile) and added a few features I wanted on top of it.

Footprint Chart by Th16rryDescription of the "Footprint Chart" Indicator
This indicator is an approximation of a true **Footprint Chart** adapted for TradingView, which does not provide access to tick-by-tick data or detailed order book information. It relies on **heuristics** to estimate the distribution of volume between buyers and sellers for each candlestick.
Key Features:
- Estimation of Buy/Sell Volume:
The indicator splits the total volume of a candlestick into two parts based on the candle's nature:
- For a bullish candle (close > open), it assumes that **60% of the volume** is executed on the ask (buys) and **40% on the bid** (sells).
- For a bearish candle (close < open), the estimation is reversed (40% buys, 60% sells).
- For a neutral candle (close = open), the volume is evenly distributed at 50% for each side.
- Calculation of a Simplified Delta:
The delta is defined as the difference between the estimated buy volume and sell volume. This delta helps quickly identify the dominant market pressure—positive for buyer dominance and negative for seller dominance.
- Visual Display:
- A label is placed on each candlestick displaying the delta value, with a green background for a positive delta (indicating buying pressure) and red for a negative delta (indicating selling pressure).
- A table in the top-right corner of the chart summarizes the estimated volumes for the current candle: buy volume, sell volume, and total volume.
#### How to Use the Indicator:
- Analyzing Buy/Sell Pressure:
By observing the label's color and the delta value, a trader can quickly assess whether the market shows a dominant buying or selling pressure during a given candle.
- Complementing Other Tools:
This indicator can be used alongside other technical analysis tools, such as the Volume Profile or trend indicators, to gain a more comprehensive understanding of market behavior.
- Supporting Decision Making:
By providing a visual estimate of the volume distribution, it can help identify divergences between price movement and volume activity, which may signal potential reversals or confirm ongoing trends.
Limitations:
- Heuristic Approximation:
The method of volume distribution is based on simple assumptions and does not reflect the actual order flow, which would require tick-by-tick data to be accurately represented.
- Data Limitations on TradingView:
Due to TradingView’s restrictions on accessing detailed order book data, this indicator can only approximate a Footprint Chart and does not replace specialized tools.
In summary, the "Footprint Chart" indicator provides a visual and quick estimation of the volume distribution between buyers and sellers for each candlestick, offering valuable insights into order flow dynamics while remaining aware of its heuristic limitations.

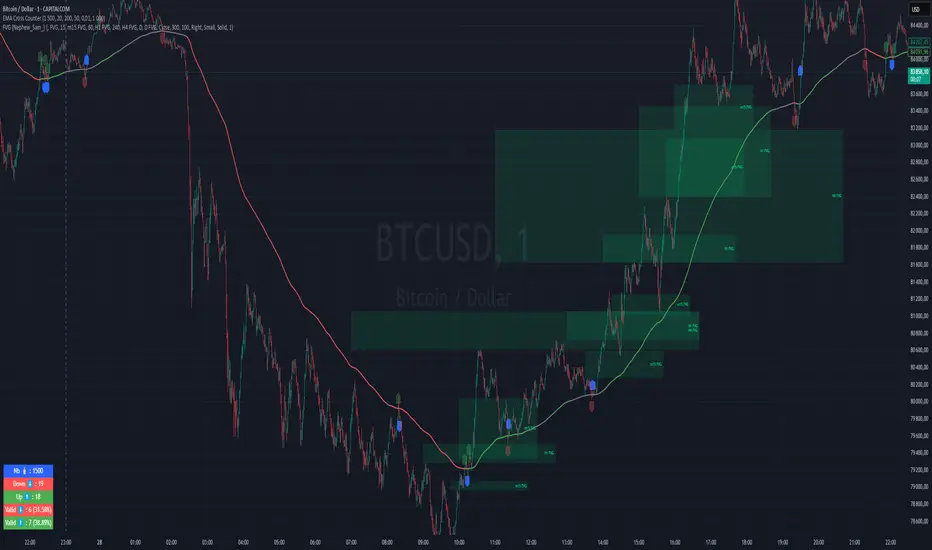
EMA Cross CounterEMA Cross Counter – Trend & Crossover Analyzer
🔥 Description
The EMA Cross Counter is an advanced indicator designed to detect price crossovers with the EMA 200 and provide insightful trend analysis. It highlights valid signals and displays success statistics directly on the chart.
🎯 Key Features
✅ Crossover Detection: Identifies moments when the price crosses the EMA 200 upward or downward.
✅ Signal Filtering: Valid signals (leading to sustained trends) are shown in blue, while invalid signals are faded.
✅ Performance Analysis: A statistics table shows the number of crossovers and their success rate.
✅ Dynamic EMA Coloring:
🟢 Green when the trend is bullish
🔴 Red when the trend is bearish
⚪ Gray when the market is in a range
✅ Range Detection: If the price remains within a narrow range for 30 candles, the EMA turns gray to indicate trend uncertainty.
✅ Stop-Loss (SL) Display: A dashed red line appears below sell signals and above buy signals (adjustable in pips).
✅ Automatic Alerts: Get notified when a significant crossover occurs.
📈 How to Use It?
1️⃣ Look for blue signals as potential trade entries.
2️⃣ Avoid trading when the EMA is gray (ranging market).
3️⃣ Use success rate statistics to evaluate crossover reliability.
4️⃣ Adjust SL distance in the settings to match your risk management strategy.
🛠 Customization Options
Adjustable EMA period
Configurable range threshold
SL distance customizable in pips
Enable/Disable alerts
💡 Ideal for scalping and swing trading, this indicator offers clear trend insights to enhance your decision-making process!
💬 Try it out and share your feedback! 🚀
Volume Pressure Histogram (Normalized)Overview
The Volume Pressure Histogram is designed to help traders analyze buying and selling pressure using real volume data.
Unlike traditional momentum indicators that rely solely on price movements, VPH measures the strength of bullish and bearish volume, providing insights into market participation.
How It Works
The histogram represents the difference between buying and selling volume over a selected period.
Green bars indicate strong buying pressure, while red bars signal strong selling pressure.
Lime and orange bars (if enabled) represent moderate buying and selling activity.
A white signal line smooths volume data to track momentum shifts over time.
How to Use It
Trend Confirmation: When price is rising and green bars increase, the trend is supported by real buying pressure.
Reversal Detection: If price makes a new high but green bars shrink, buyers may be losing strength.
Breakout Strength: A breakout with rising volume pressure confirms strong participation, while weak volume pressure suggests a potential fake move.
Divergence Signals: If price moves higher, but volume pressure declines, the move may lack conviction and could reverse.
Customization Options
Threshold Multiplier (default = 20) controls when green and red bars appear, filtering out weaker signals.
Log Scale Option helps normalize extreme volume spikes.
Adjustable Smoothing Length for both the histogram and signal line.
Why Use This Indicator
Provides a volume-based approach to analyzing market trends.
Can confirm or contradict price movements, helping identify strong or weak trends.
Works across multiple markets, including stocks, forex, crypto, and indices.
This indicator is designed for educational and informational purposes only and does not provide financial advice.

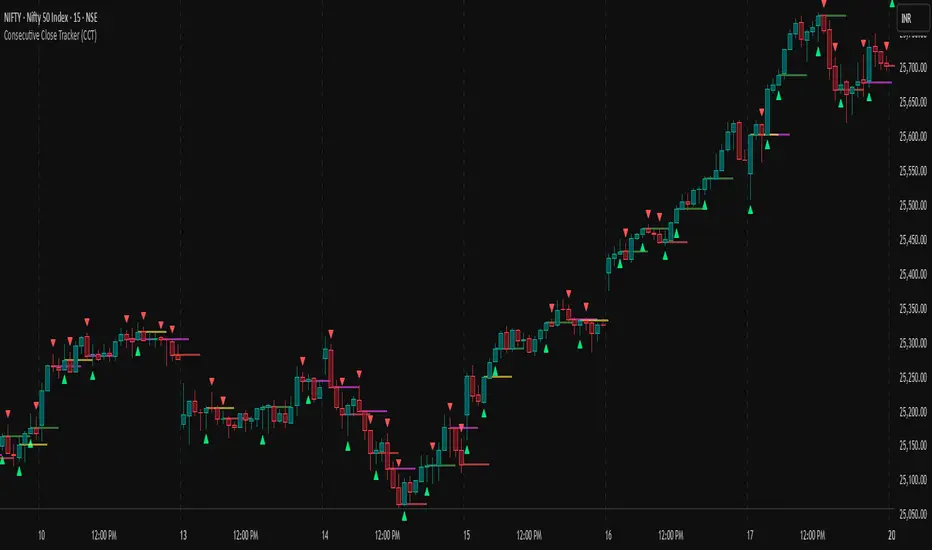
Consecutive Close Tracker (CCT)Consecutive Close Tracker (CCT) Indicator
The Consecutive Close Tracker (CCT) is a powerful momentum and breakout detection tool designed to identify consecutive bullish and bearish closes, potential reversals, and breakout points. By tracking consecutive candle closes and plotting key levels, this indicator provides traders with visual cues to recognize trend continuations, reversals, and breakout opportunities effectively.
🔹 Key Features of CCT
1️⃣ Consecutive Move Lines (Green/Red/Yellow Lines)
Tracks three consecutive bullish or bearish closes.
If the fourth candle confirms the trend, a green line (bullish) or red line (bearish) is drawn.
If the fourth candle fails to confirm, a yellow line is drawn, signaling potential indecision.
Helps traders spot trend continuations and exhaustion points.
2️⃣ Reversal Detection Lines (Cyan & Light Red)
Identifies bullish and bearish reversals based on three higher/lower closes followed by a reversal.
A cyan line indicates a bullish reversal, while a light red line signals a bearish reversal.
Useful for traders looking for trend reversals and key turning points.
3️⃣ Breakout Line (Dynamic Resistance/Support Level)
Automatically calculates a breakout level based on the previous timeframe’s open and close.
Can be customized to use different timeframes (e.g., hourly, daily, weekly).
Acts as a dynamic resistance or support level, helping traders determine breakout opportunities.
🔍 How to Use the Indicator?
✅ 1. Spotting Trend Continuations with Consecutive Move Lines
Green Line: Three consecutive bullish closes followed by a fourth higher close.
🚀 Indicates strong buying pressure & potential uptrend continuation.
Red Line: Three consecutive bearish closes followed by a fourth lower close.
📉 Indicates strong selling pressure & potential downtrend continuation.
Yellow Line: Three consecutive closes, but the fourth candle fails to confirm.
⚠️ Signals possible indecision or trend exhaustion.
🔥 Best Strategy:
If a green line appears near support, consider long entries.
If a red line appears near resistance, consider short entries.
If a yellow line appears, wait for further confirmation before entering a trade.
✅ 2. Identifying Trend Reversals with Reversal Lines
Cyan Line: A bearish trend with three consecutive lower closes, followed by a bullish candle → Possible uptrend reversal.
Light Red Line: A bullish trend with three consecutive higher closes, followed by a bearish candle → Possible downtrend reversal.
🔥 Best Strategy:
If a cyan line appears near a major support level, look for long entry opportunities.
If a light red line appears near resistance, prepare for a potential short entry.
Use these lines in combination with candlestick patterns (e.g., bullish engulfing, pin bars) for confirmation.
✅ 3. Using the Breakout Line for Key Entry & Exit Points
The breakout line represents a key dynamic level (midpoint of the previous timeframe’s open & close).
If price breaks above the breakout line, it suggests bullish momentum → Consider long trades.
If price breaks below the breakout line, it suggests bearish momentum → Consider short trades.
🔥 Best Strategy:
Use the breakout line in combination with support & resistance levels.
When price approaches the breakout line, watch for confirmation candles before entering a trade.
The breakout line can also act as a stop-loss or take-profit level.
🎯 How to Utilize CCT Effectively?
✅ For Intraday Traders
Use the consecutive close tracker on a 5M or 15M chart to catch short-term trends.
Watch for reversal lines near major intraday support/resistance for quick scalping opportunities.
Use the breakout line from the hourly chart to identify potential trend shifts.
✅ For Swing Traders
Apply the indicator on 1H, 4H, or daily charts to track medium-term trends.
Look for green/red lines near key Fibonacci retracement or pivot levels.
Use reversal lines to detect early trend reversals before bigger moves occur.
✅ For Breakout Traders
Focus on the breakout line on higher timeframes (e.g., 1H, 4H, Daily) to identify strong momentum shifts.
If price crosses the breakout line with strong volume, enter trades with trend confirmation.
Place stop-loss just below the breakout level for controlled risk management.
🏆 Final Thoughts
The Consecutive Close Tracker (CCT) is a powerful momentum and reversal indicator that helps traders:
✅ Identify strong trend continuations (green/red lines).
✅ Detect early reversal points (cyan/light red lines).
✅ Use a dynamic breakout line for better trade entries & exits.
Whether you’re an intraday trader, swing trader, or breakout trader, this tool can enhance your market insights and improve your trading decisions. 📈🔥
🚀 Try it out, and integrate it with your strategy to maximize its potential! 🚀
ATR Table with Average [filatovlx]ATR indicator with advanced analytics
Description:
The ATR (Average True Range) indicator is a powerful tool for analyzing market volatility. Our indicator not only calculates the classic ATR, but also provides additional metrics that will help traders make more informed decisions. The indicator displays key values in a convenient table, which makes it ideal for trading in any market: stocks, forex, cryptocurrencies and others.
Main functions:
Current ATR value:
Current ATR (Points) — the current ATR value in points. It shows the absolute level of volatility.
Current ATR (%) — the current ATR value as a percentage of the price. It helps to estimate the volatility relative to the current price of an asset.
The ATR value on the previous bar:
ATR 1 Bar Ago (Points) — the ATR value on the previous bar in points. Allows you to compare the current volatility with the previous one.
ATR 1 Bar Ago (%) — the ATR value on the previous bar as a percentage. It is convenient for analyzing changes in volatility
Индикатор ATR с расширенной аналитикой
Описание:
Индикатор ATR (Average True Range) — это мощный инструмент для анализа волатильности рынка. Наш индикатор не только рассчитывает классический ATR, но и предоставляет дополнительные метрики, которые помогут трейдерам принимать более обоснованные решения. Индикатор отображает ключевые значения в удобной таблице, что делает его идеальным для использования в торговле на любых рынках: акции, форекс, криптовалюты и другие.
Основные функции:
Текущее значение ATR:
Current ATR (Points) — текущее значение ATR в пунктах. Показывает абсолютный уровень волатильности.
Current ATR (%) — текущее значение ATR в процентах от цены. Помогает оценить волатильность относительно текущей цены актива.
Значение ATR на предыдущем баре:
ATR 1 Bar Ago (Points) — значение ATR на предыдущем баре в пунктах. Позволяет сравнить текущую волатильность с предыдущей.
ATR 1 Bar Ago (%) — значение ATR на предыдущем баре в процентах. Удобно для анализа изменения волатильности.
Среднее значение ATR за последние 5 баров:
ATR Avg (5 Bars) (Points) — среднее значение ATR за последние 5 баров в пунктах. Показывает сглаженный уровень волатильности.
ATR Avg (5 Bars) (%) — среднее значение ATR за последние 5 баров в процентах. Помогает оценить общий тренд волатильности.
Преимущества индикатора:
Удобство использования: Все ключевые значения выводятся в компактной таблице, что экономит время на анализ.
Гибкость: Возможность настройки периода ATR и длины скользящего среднего под ваши торговые стратегии.
Универсальность: Подходит для любых рынков и таймфреймов.
Наглядность: Процентные значения ATR помогают быстро оценить уровень волатильности относительно цены актива.
Повышение точности: Дополнительные метрики (например, среднее значение ATR) позволяют лучше понимать текущую рыночную ситуацию.
Для кого этот индикатор?
Трейдеры, которые хотят лучше понимать волатильность рынка.
Скальперы и внутридневные трейдеры, которым важно быстро оценивать изменения волатильности.
Инвесторы, которые используют ATR для определения стоп-лоссов и тейк-профитов.
Разработчики торговых стратегий, которым нужны точные данные для тестирования и оптимизации.
Как это работает?
Индикатор автоматически рассчитывает все значения и выводит их в таблицу на графике. Вам не нужно вручную считать или анализировать данные — просто добавьте индикатор на график, и вся информация будет перед вами.

Enhanced KLSE Banker Flow Oscillator# Enhanced KLSE Banker Flow Oscillator
## Description
The Enhanced KLSE Banker Flow Oscillator is a sophisticated technical analysis tool designed specifically for the Malaysian stock market (KLSE). This indicator analyzes price and volume relationships to identify potential smart money movements, providing early signals for market reversals and continuation patterns.
The oscillator measures the buying and selling pressure in the market with a focus on detecting institutional activity. By combining money flow calculations with volume filters and price action analysis, it helps traders identify high-probability trading opportunities with reduced noise.
## Key Features
- Dual-Timeframe Analysis: Combines long-term money flow trends with short-term momentum shifts for more accurate signals
- Adaptive Volume Filtering: Automatically adjusts volume thresholds based on recent market conditions
- Advanced Divergence Detection: Identifies potential trend reversals through price-flow divergences
- Early Signal Detection: Provides anticipatory signals before major price movements occur
- Multiple Signal Types: Offers both early alerts and strong confirmation signals with clear visual markers
- Volatility Adjustment: Adapts sensitivity based on current market volatility for more reliable signals
- Comprehensive Visual Feedback: Color-coded oscillator, signal markers, and optional text labels
- Customizable Display Options: Toggle momentum histogram, early signals, and zone fills
- Organized Settings Interface: Logically grouped parameters for easier configuration
## Indicator Components
1. Main Oscillator Line: The primary banker flow line that fluctuates above and below zero
2. Early Signal Line: Secondary indicator showing potential emerging signals
3. Momentum Histogram: Visual representation of flow momentum changes
4. Zone Fills: Color-coded background highlighting positive and negative zones
5. Signal Markers: Visual indicators for entry and exit points
6. Reference Lines: Key levels for strong and early signals
7. Signal Labels: Optional text annotations for significant signals
## Signal Types
1. Strong Buy Signal (Green Arrow): Major bullish signal with high probability of success
2. Strong Sell Signal (Red Arrow): Major bearish signal with high probability of success
3. Early Buy Signal (Blue Circle): First indication of potential bullish trend
4. Early Sell Signal (Red Circle): First indication of potential bearish trend
5. Bullish Divergence (Yellow Triangle Up): Price making lower lows while flow makes higher lows
6. Bearish Divergence (Yellow Triangle Down): Price making higher highs while flow makes lower highs
## Parameters Explained
### Core Settings
- MFI Base Length (14): Primary calculation period for money flow index
- Short-term Flow Length (5): Calculation period for early signals
- KLSE Sensitivity (1.8): Multiplier for flow calculations, higher = more sensitive
- Smoothing Length (5): Smoothing period for the main oscillator line
### Volume Filter Settings
- Volume Filter % (65): Minimum volume threshold as percentage of average
- Use Adaptive Volume Filter (true): Dynamically adjusts volume thresholds
### Signal Levels
- Strong Signal Level (15): Threshold for strong buy/sell signals
- Early Signal Level (10): Threshold for early buy/sell signals
- Early Signal Threshold (0.75): Sensitivity factor for early signals
### Advanced Settings
- Divergence Lookback (34): Period for checking price-flow divergences
- Show Signal Labels (true): Toggle text labels for signals
### Visual Settings
- Show Momentum Histogram (true): Toggle the momentum histogram display
- Show Early Signal (true): Toggle the early signal line display
- Show Zone Fills (true): Toggle background color fills
## How to Use This Indicator
### Installation
1. Add the indicator to your TradingView chart
2. Default settings are optimized for KLSE stocks
3. Customize parameters if needed for specific stocks
### Basic Interpretation
- Oscillator Above Zero: Bullish bias, buying pressure dominates
- Oscillator Below Zero: Bearish bias, selling pressure dominates
- Crossing Zero Line: Potential shift in market sentiment
- Extreme Readings: Possible overbought/oversold conditions
### Advanced Interpretation
- Divergences: Early warning of trend exhaustion
- Signal Confluences: Multiple signal types appearing together increase reliability
- Volume Confirmation: Signals with higher volume are more significant
- Momentum Alignment: Histogram should confirm direction of main oscillator
### Trading Strategies
#### Trend Following Strategy
1. Identify market trend direction
2. Wait for pullbacks shown by oscillator moving against trend
3. Enter when oscillator reverses back in trend direction with a Strong signal
4. Place stop loss below/above recent swing low/high
5. Take profit at previous resistance/support levels
#### Counter-Trend Strategy
1. Look for oscillator reaching extreme levels
2. Identify divergence between price and oscillator
3. Wait for oscillator to cross Early signal threshold
4. Enter position against prevailing trend
5. Use tight stop loss (1 ATR from entry)
6. Take profit at first resistance/support level
#### Breakout Confirmation Strategy
1. Identify stock consolidating in a range
2. Wait for price to break out of range
3. Confirm breakout with oscillator crossing zero line in breakout direction
4. Enter position in breakout direction
5. Place stop loss below/above the breakout level
6. Trail stop as price advances
### Signal Hierarchy and Reliability
From highest to lowest reliability:
1. Strong Buy/Sell signals with divergence and high volume
2. Strong Buy/Sell signals with high volume
3. Divergence signals followed by Early signals
4. Strong Buy/Sell signals with normal volume
5. Early Buy/Sell signals with high volume
6. Early Buy/Sell signals with normal volume
## Complete Trading Plan Example
### KLSE Market Trading System
#### Pre-Trading Preparation
1. Review overall market sentiment (bullish, bearish, or neutral)
2. Scan for stocks showing significant banker flow signals
3. Note key support/resistance levels for watchlist stocks
4. Prioritize trade candidates based on signal strength and volume
#### Entry Rules for Long Positions
1. Banker Flow Oscillator above zero line (positive flow environment)
2. One or more of the following signals present:
- Strong Buy signal (green arrow)
- Bullish Divergence signal (yellow triangle up)
- Early Buy signal (blue circle) with confirming price action
3. Entry confirmation requirements:
- Volume above 65% of 20-day average
- Price above short-term moving average (e.g., 20 EMA)
- No immediate resistance within 3% of entry price
4. Entry on the next candle open after signal confirmation
#### Entry Rules for Short Positions
1. Banker Flow Oscillator below zero line (negative flow environment)
2. One or more of the following signals present:
- Strong Sell signal (red arrow)
- Bearish Divergence signal (yellow triangle down)
- Early Sell signal (red circle) with confirming price action
3. Entry confirmation requirements:
- Volume above 65% of 20-day average
- Price below short-term moving average (e.g., 20 EMA)
- No immediate support within 3% of entry price
4. Entry on the next candle open after signal confirmation
#### Position Sizing Rules
1. Base risk per trade: 1% of trading capital
2. Position size calculation: Capital × Risk% ÷ Stop Loss Distance
3. Position size adjustments:
- Increase by 20% for Strong signals with above-average volume
- Decrease by 20% for Early signals without confirming price action
- Standard size for all other valid signals
#### Stop Loss Placement
1. For Long Positions:
- Place stop below the most recent swing low
- Minimum distance: 1.5 × ATR(14)
- Maximum risk: 1% of trading capital
2. For Short Positions:
- Place stop above the most recent swing high
- Minimum distance: 1.5 × ATR(14)
- Maximum risk: 1% of trading capital
#### Take Profit Strategy
1. First Target (33% of position):
- 1.5:1 reward-to-risk ratio
- Move stop to breakeven after reaching first target
2. Second Target (33% of position):
- 2.5:1 reward-to-risk ratio
- Trail stop at previous day's low/high
3. Final Target (34% of position):
- 4:1 reward-to-risk ratio or
- Exit when opposing signal appears (e.g., Strong Sell for long positions)
#### Trade Management Rules
1. After reaching first target:
- Move stop to breakeven
- Consider adding to position if new confirming signal appears
2. After reaching second target:
- Trail stop using banker flow signals
- Exit remaining position when:
- Oscillator crosses zero line in opposite direction
- Opposing signal appears
- Price closes below/above trailing stop level
3. Maximum holding period:
- 20 trading days for trend-following trades
- 10 trading days for counter-trend trades
- Re-evaluate if targets not reached within timeframe
#### Risk Management Safeguards
1. Maximum open positions: 5 trades
2. Maximum sector exposure: 40% of trading capital
3. Maximum daily drawdown limit: 3% of trading capital
4. Mandatory stop trading rules:
- After three consecutive losing trades
- After reaching 5% account drawdown
- Resume after two-day cooling period and strategy review
#### Performance Tracking
1. Track for each trade:
- Signal type that triggered entry
- Oscillator reading at entry and exit
- Volume relative to average
- Price action confirmation patterns
- Holding period
- Reward-to-risk achieved
2. Review performance metrics weekly:
- Win rate by signal type
- Average reward-to-risk ratio
- Profit factor
- Maximum drawdown
3. Adjust strategy parameters based on performance:
- Increase position size for highest performing signals
- Decrease or eliminate trades based on underperforming signals
## Advanced Usage Tips
1. Combine with Support/Resistance:
- Signals are more reliable when they occur at key support/resistance levels
- Look for banker flow divergence at major price levels
2. Multiple Timeframe Analysis:
- Use the oscillator on both daily and weekly timeframes
- Stronger signals when both timeframes align
- Enter on shorter timeframe when confirmed by longer timeframe
3. Sector Rotation Strategy:
- Compare banker flow across different sectors
- Rotate capital to sectors showing strongest positive flow
- Avoid sectors with persistent negative flow
4. Volatility Adjustments:
- During high volatility periods, wait for Strong signals only
- During low volatility periods, Early signals can be more actionable
5. Optimizing Parameters:
- For more volatile stocks: Increase Smoothing Length (6-8)
- For less volatile stocks: Decrease KLSE Sensitivity (1.2-1.5)
- For intraday trading: Reduce all length parameters by 30-50%
## Fine-Tuning for Different Markets
While optimized for KLSE, the indicator can be adapted for other markets:
1. For US Stocks:
- Reduce KLSE Sensitivity to 1.5
- Increase Volume Filter to 75%
- Adjust Strong Signal Level to 18
2. For Forex:
- Increase Smoothing Length to 8
- Reduce Early Signal Threshold to 0.6
- Focus more on divergence signals than crossovers
3. For Cryptocurrencies:
- Increase KLSE Sensitivity to 2.2
- Reduce Signal Levels (Strong: 12, Early: 8)
- Use higher Volume Filter (80%)
By thoroughly understanding and properly implementing the Enhanced KLSE Banker Flow Oscillator, traders can gain a significant edge in identifying institutional money flow and making more informed trading decisions, particularly in the Malaysian stock market.

Dynamic Breakout Master by tradingbauhaus 🌟 Code Description:
This Pine Script implements a trading strategy called "Dynamic Breakout Master" 💥. The core idea of the strategy is to identify breakouts (price movements) at key support 💙 and resistance 🔴 levels, through a dynamic channel that adapts to the market’s conditions. Here's how it works:
🔧 Customizable Input Parameters:
🧭 Pivot Period: This defines the number of bars (candles) to the left and right used to detect pivots (highs and lows) that mark the support and resistance zones.
📊 Data Source: You can choose whether to use highs and lows or closes and opens of the candles to identify the pivots.
📏 Max Channel Width: Specifies the maximum width allowed for the support/resistance channel, expressed as a percentage over the last 300 bars.
💪 Minimum Pivot Strength: This defines the minimum number of pivots needed for a support or resistance level to be considered valid.
🏔 Max Support/Resistance Zones: Limits the number of key zones displayed on the chart.
📅 Lookback Period: Adjusts how many bars back the system should check to find and validate support and resistance levels.
🎨 Custom Colors: You can choose colors for the support, resistance, and in-channel zones.
📉 Moving Averages (MA): The strategy allows adding up to two moving averages (SMA or EMA) to assist in making trading decisions.
📊 Calculating Support/Resistance Levels:
The system uses an algorithm to identify pivots from prices and calculates dynamic support and resistance zones 🔒🔓.
The closer the pivots are and the stronger their influence, the more relevant the zone becomes for the strategy.
The dynamic channel is drawn on the chart, with a maximum width limit for these zones defined by the input parameter.
📈 Trading Logic:
🚀 Identifying Breakouts:
The strategy looks for when the price breaks (breakouts) a resistance or support level.
If the price breaks upward through the resistance level, a buy order 📈 is triggered.
If the price breaks downward through the support level, a sell order 📉 is triggered.
🔔 Alerts:
Resistance Break (ResBreak) and Support Break (SupBreak) alerts are configured to notify users when a significant breakout occurs.
💰 Commissions:
The strategy includes a commission (0.1%) to simulate transaction costs for each trade.
📊 Chart Visualization:
The support and resistance zones are displayed as colored rectangles:
🔴 Resistance (red) and
🔵 Support (blue).
Pivots of support and resistance can be labeled as P (for resistance) and V (for support).
Breakouts of support or resistance levels are marked with triangles that appear on the chart 🔺🔻.
📈 Trading Strategy:
If the price breaks upward through the resistance level, a long position (buy) 📈 is opened.
If the price breaks downward through the support level, a short position (sell) 📉 is opened.
🏆 Conclusion:
This script is a dynamic breakout strategy 💥 that allows traders to capture significant price movements when support or resistance channels break. The customizable parameters let users fine-tune the strategy according to their preferences, while the visual alerts on the chart make it easier to follow trading opportunities. The inclusion of moving averages and key price zones adds an extra layer of analysis to improve decision-making 💡.

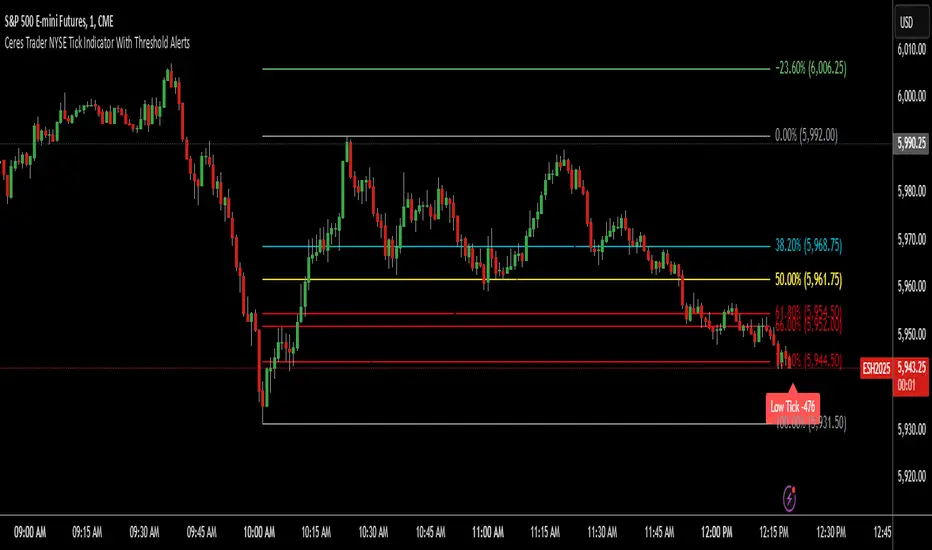
Ceres Trader NYSE Tick Indicator With Threshold AlertsThe Ceres Trader NYSE Tick Indicator provides real-time alerts for significant shifts in the NYSE Tick, empowering traders to identify potential overbought and oversold market conditions. It displays labels directly on the chart when the Tick reaches predefined thresholds, offering a clear and immediate visual representation of market sentiment.
Key Features:
Threshold-Based Alerts:
Highlights "High Tick" and "Low Tick" conditions when the Tick exceeds user-defined thresholds (default: 400 and -400).
Identifies "Extreme High Tick" and "Extreme Low Tick" conditions for more significant shifts (adjusted default: 800 and -800).
Visual Labels:
Displays colored labels directly on the price chart, indicating the type of Tick event and its value.
Green labels signal potential overbought conditions, while red labels indicate potential oversold conditions.
Low tick labels are placed below the price bar, and high tick labels are placed above the price bar for improved visibility.
Real-Time Data:
Utilizes the NYSE Tick symbol ("TICK") to provide up-to-the-minute market data.
User-Friendly Design:
Simple and intuitive design, suitable for traders of all experience levels.
How to Use:
Add the "Ceres Trader NYSE Tick Indicator with Threshold Alerts" to your TradingView chart.
Observe the colored labels that appear when the Tick reaches the specified thresholds.
Use these alerts to identify potential trading opportunities based on overbought or oversold market conditions.
Consider adjusting the threshold values within the indicator settings to align with your specific trading strategy.
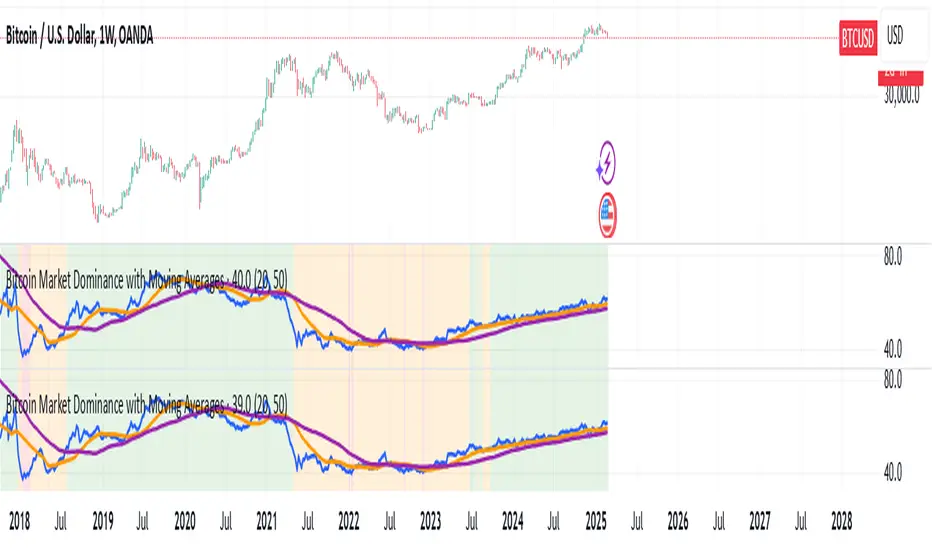
Bitcoin Market Dominance with Moving AveragesBitcoin Market Dominance with Moving Averages
This Pine Script indicator tracks Bitcoin market dominance by calculating the percentage of Bitcoin's market capitalization relative to the total cryptocurrency market cap.
Features:
✅ Real-time BTC Dominance Calculation: Displays the percentage of Bitcoin’s market share.
✅ Moving Averages: Includes two customizable moving averages for trend analysis.
✅ Visual Alerts: Background colors indicate different dominance levels:
Green: BTC dominance is above 50% (strong BTC market control).
Red: BTC dominance is below 40% (altcoins gaining strength).
Orange: BTC dominance is between 40%-50% (neutral zone).
This tool helps traders analyze Bitcoin’s influence on the crypto market and identify key dominance trends.
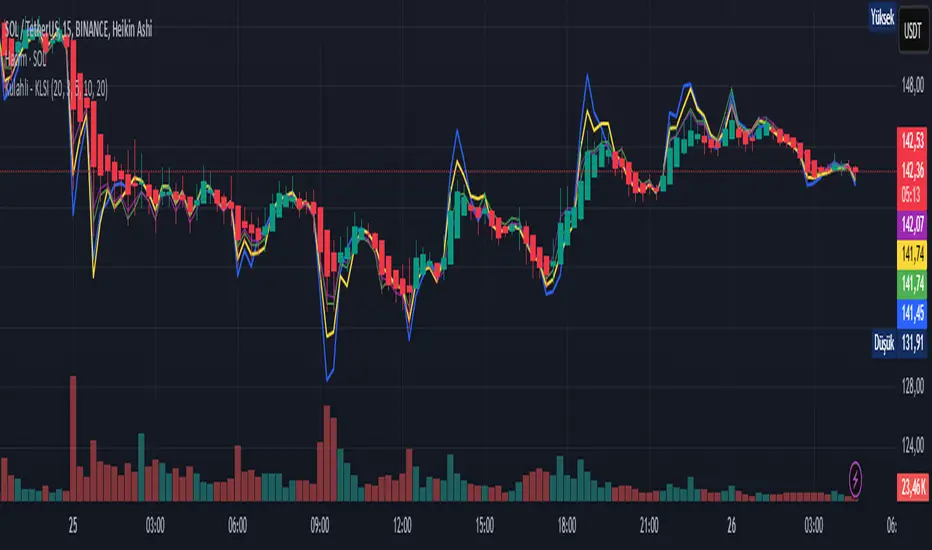
Kulahli - KLSIDynamic Price Levels & Trend Tracker
Description
This indicator focuses on identifying dynamically changing price levels and determining the trend direction.
Key Features:
Dynamic Level Calculation: Price levels are continuously recalculated in a way that is sensitive to market conditions.
Trend Indicator: Based on how long the price stays above or below a certain level, the indicator shows the trend direction (uptrend or downtrend).
Color Coding: Price levels and trend direction are coded with different colors for easy visual identification.
Customizable Sensitivity: Offers sensitivity settings to adjust how quickly the indicator reacts to price changes.
Alert Options: Can be configured to receive alerts when the price crosses a specific level or when the trend direction changes.
How to Use:
Disclaimer:
This indicator is for educational and informational purposes only and should not be considered financial advice.
Past performance is not indicative of future results.1
Use at your own risk.
Feel free to adjust this draft according to the specific features and functions of your indicator.
Fibonacci Pivot Points & Previous D,W&M Highs/LowsIndicator Overview
This indicator combines Fibonacci Pivot Points with previous high and low levels for different timeframes (day, week, month). It plots these levels on the chart to provide traders with key support and resistance areas, making it easier to identify potential trading opportunities.
Features
Fibonacci Pivot Points:
The indicator calculates pivot points based on the high, low, and close prices.
Fibonacci levels are used to determine support (S1, S2, S3, S4, S5) and resistance (R1, R2, R3, R4, R5) levels.
Users can customize the Fibonacci levels for both support and resistance.
Previous Highs and Lows:
The indicator plots previous day, week, and month high and low levels.
Each of these lines can be customized in terms of visibility, color, and width.
This helps traders to see key historical levels that might act as support or resistance in the future.
Inputs and Customization:
Fibonacci Time Frame:
Users can select the timeframe for calculating the pivot points (Daily, Weekly, Monthly).
Fibonacci Levels:
Customizable input fields for each Fibonacci level (R1, R2, R3, R4, R5, S1, S2, S3, S4, S5).
Previous High/Low Lines:
Day Lines:
Options to show or hide previous day's high/low lines.
Customizable color and width for these lines.
Week Lines:
Options to show or hide previous week's high/low lines.
Customizable color and width for these lines.
Month Lines:
Options to show or hide previous month's high/low lines.
Customizable color and width for these lines.
Technical Calculations:
Fibonacci Pivot Points:
Calculated as:
pp = (High + Low + Close) / 3
S1 = pp - ((High - Low) * Fibonacci Level)
R1 = pp + ((High - Low) * Fibonacci Level)
Previous High/Low Levels:
Uses request.security to fetch previous high and low values for the selected timeframe.
Plotted using line.new to draw lines across the chart.
Plotting:
The indicator plots Fibonacci Pivot Points and previous high/low lines on the chart, using distinct colors for each level.
Customizable transparency and linewidths make it easier to visually interpret the levels.
This indicator is particularly useful for traders who rely on technical analysis to identify key support and resistance levels, offering a blend of historical data and Fibonacci-based predictions.
Feel free to ask if you have any specific questions or need further adjustments!

MH Strategy – Hull Moving Average-Based Trading StrategyThe MH Strategy is a TradingView strategy that leverages the Hull Moving Average (HullMA) to generate precise buy and sell signals. This strategy is designed to identify trend reversals and momentum shifts using a combination of weighted moving averages and HullMA-based calculations.
Key Features:
✅ Hull Moving Average-Based Signals – Uses a modified HullMA calculation to detect trend changes.
✅ Dynamic Support & Resistance – The strategy plots adaptive levels that act as dynamic entry and exit points.
✅ Trend-Based Entries & Exits – Generates long (buy) signals when the price moves above the calculated Hull retraction level and short (sell) signals when the price moves below it.
✅ Automated Trade Execution – Integrates with TradingView’s strategy function to open and close trades automatically based on signal conditions.
✅ Customizable Parameters – Allows users to adjust the HullMA period and price data source to optimize performance across different markets and timeframes.
How It Works:
HullMA Calculation: The strategy calculates a smoothed Hull Moving Average (HullMA) using a two-step weighted moving average method.
Trend Confirmation: The difference between the HullMA values helps determine trend direction and retraction levels.
Entry Conditions:
A buy signal is generated when the price is above the retraction level, and the previous price confirms the trend.
A sell signal is triggered when the price is below the retraction level with trend confirmation.
Exit Conditions:
The strategy closes long trades when the price drops below a threshold.
It closes short trades when the price rises above a set level.
Ideal Use Cases:
🔹 Swing & trend traders looking for momentum-based entries and exits.
🔹 Traders aiming for reduced lag compared to traditional moving averages.
🔹 Markets with strong price trends, such as forex, stocks, and crypto.
Try the MH Strategy and enhance your trading decisions with a refined HullMA-based trend detection system! 🚀

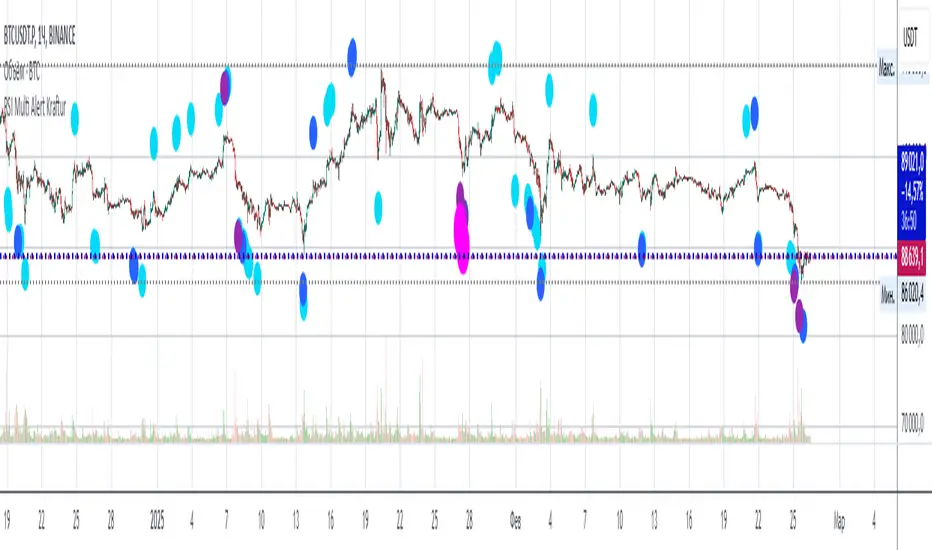
RSI Multi Alert KrafturRSI Multi Alert Kraftur
Description
The "RSI Multi-Level Signals" indicator is designed to help traders identify potential buy and sell opportunities based on RSI (Relative Strength Index) crossings of multiple customizable levels. Unlike traditional RSI indicators that focus on single overbought/oversold thresholds (e.g., 70/30), this script stands out by offering four distinct buy and sell levels for enhanced flexibility and precision. It plots signals directly on the price chart and provides real-time alerts when RSI crosses these levels, making it a powerful tool for spotting entry and exit points.
Key Features
Multi-Level RSI: Configurable buy levels (e.g., 30, 25, 20, 15) and sell levels (e.g., 70, 75, 80, 85) to capture varying degrees of overbought and oversold conditions.
Visual Signals: Buy signals are marked with circles below the bars, and sell signals above the bars, each color-coded for easy identification.
Real-Time Alerts: Generates alerts once per bar when RSI crosses a level, with a filter to prevent duplicate signals during oscillations.
Customizable: Adjustable RSI length, timeframe, and level colors to suit different trading strategies.
Recommended Usage
This indicator is best used as a scanning tool for finding entry points across multiple assets. Set up alerts for your entire watchlist of coins or stocks to detect when RSI crosses the configured levels in real time. It’s particularly effective in volatile markets or for traders employing multi-timeframe analysis. Combine it with other indicators (e.g., support/resistance or trend filters) to confirm signals and improve accuracy.
How to Use
Apply the indicator to your chart.
Customize the RSI length, timeframe, and signal levels to match your trading style.
Set up alerts for the indicator and apply them to your watchlist of assets.
Monitor the chart for buy (green) and sell (red) signals, or rely on alert notifications.
Perfect for scalpers, swing traders, or anyone looking to automate signal detection across a portfolio!