Auto Squeeze Breakout BarsThe Auto Squeeze Breakout Bars find bars that are breaking out of a low volatility environment into a high volatility environment.
The Squeeze shading is signaled when the volatility of the asset is very low. Then the Squeeze Breakout Bars are signaled when the asset is breaking out of this low volatility structure.
Warning bars will be signaled when it is approaching a breakout, but the conditions are not fully met at that very time.
The Auto Squeeze Breakout Bar indicator also has a built in stop loss mechanic that can be set to your preferred limit.
Stop losses are highly recommended when using the breakout bars because of possible head fakes. They are rare, but can occur depending on the asset you are trading.
For Access or Questions: Private message us. Thank you.
Breakout!

X Period High/Low/MidToday we have a simple, but endlessly versatile, indicator that plots the X Period High/Low/Mid of your chosen market.
Traditionally the 52 week High/Low is used as a breakout signal. However, by changing to an X period, and adding a midway line, we create a more versatile indicator that can be tailored to various markets.
By default it's set at 250 periods (because I like the 250 period moving average), and I generally trade H4 and Daily time frames. But tweak it to your liking, you just have to modify the length periods by your desired time frame and lookback length. E.g. to create a 52 week indicator on the daily time frame, enter a length of 260 in the indicator (5 days per week * 52 weeks = 260).
For the above reason, I haven't made this indicator MTF, as there's no real need. However, if users find it easier I can look at adding it later.
Also, the mid point between an X period high/low is often a good trend-follower, as well as acting as support/resistance . I encourage you to experiment with different ways of using this indicator. Entire systems (if your risk management is correct) can be built and traded from this one indicator.
Good luck.
DD

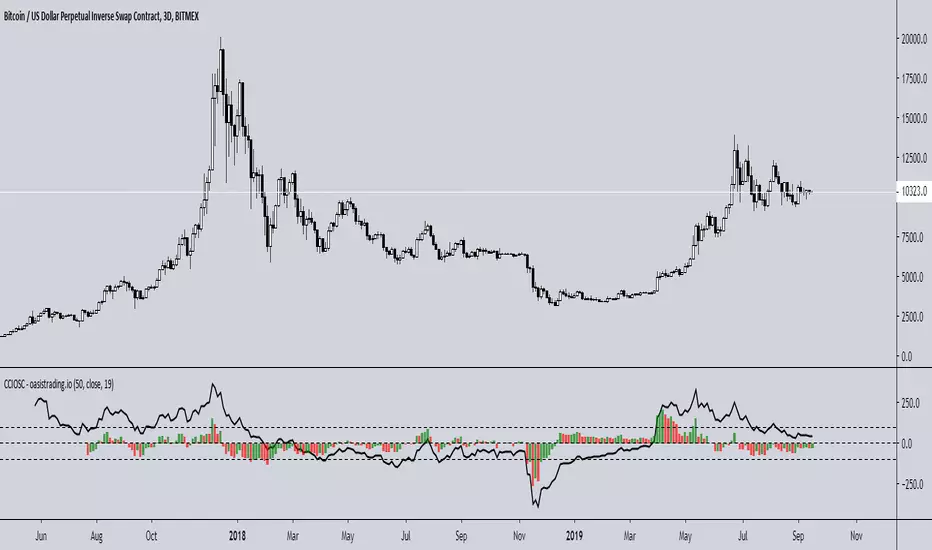
Improved CCI with Momentum OscillatorThis indicator is free to all Oasis Trading Group members.
The Improved CCI is a basic CCI with a momentum gauge applied to the zero line. This indicator is used to find breakouts/breakdowns and when they have lost momentum.
A bullish entry would be found when the CCI has broken the 100 line when the Momentum gauge is above zero or when the CCI has crossed above the -100 line when the Momentum gauge is above zero.
A bearish entry would be found when the CCI has broken the -100 line when the Momentum gauge is below zero or when the CCI has crossed below the 100 line when the Momentum gauge is below zero.
For Access or Questions: Private message us. Thank you.
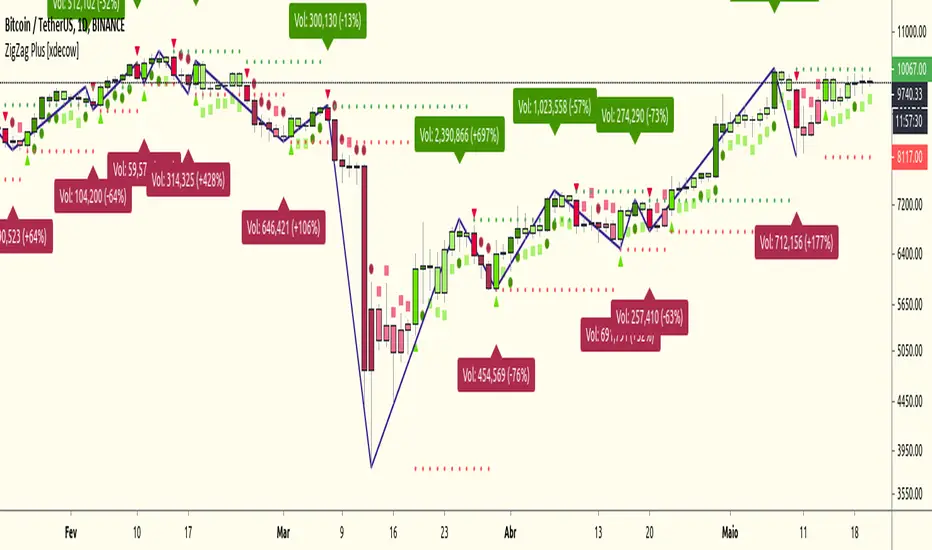
ZigZag Plus [xdecow]A ZigZag Like based on candle close.
A lot of options that can be hide in options.
Triangle/bright - reversal confirmation candle
Circle/dark - higher/lower candle breakout
Square/light - Insidebar
RSI , products of Nha Son Pleikuđây là công cụ bắt đỉnh đáy tốt nhất hiện nay.
mình áp dụng rất hiệu quả.
chia sẽ cho các bạn !!

(TBO) Trending Break OutTBO (Trending Break Out) is an indicator designed to help identify trends within the markets. Users are able to see trend continuations and potential trend reversals. Potential breakouts are also shown as trend strength increases or decreases. There are buy signals and short signals included as well. Clouds show underlying support or resistance areas and potential changes in trend strength. Pivots show resistance and support as well.
-Brought to you by Drungle_OG and MooninPapa (YouTubes)

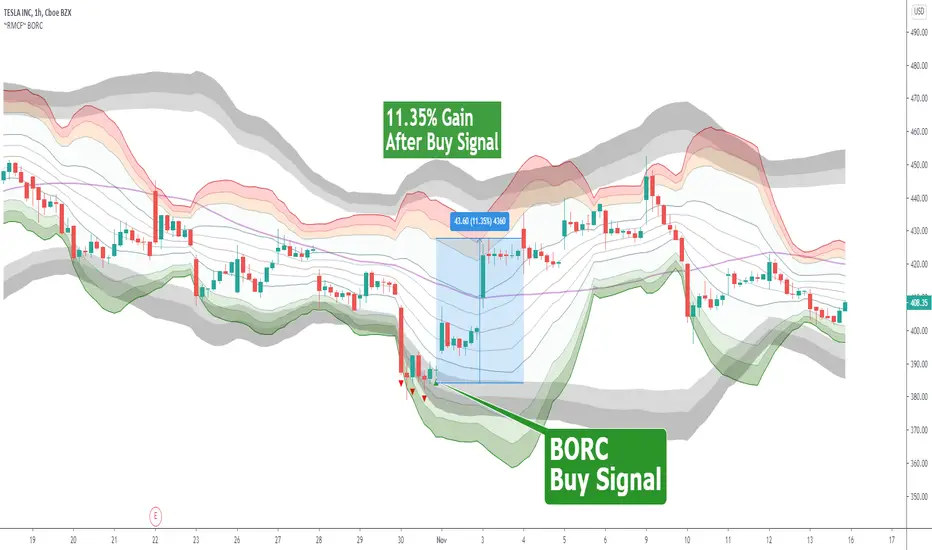
~RMCF~ BORC [with 17 page Annotated PDF with Example Charts]BORC, or Breakout Reversal Confirmation, is a signal based TV Indicator that analyzes multi-period price movements to determine when to enter in oversold and overbought tradeable assets. It works in any time frame and any type of security.
Green triangle means buy
Red Triangle means to get ready for the buy signal
$60 for lifetime access + complimentary PDF with example chart setups
DM @reaganmcf_ on twitter for more information and access
TMA Indicator v2.2This indicator is designed to show support and resistance at local extremes. Configurable SMA crossover events can be used to impart a bullish or bearish bias. This helps to reduce noise on the chart and increase profit factor. In other words, the indicator will only look for bullish breakouts if the fast moving average is above the slow moving average and vice-versa.
SMA Crossover events can be used to filter bullish or bearish resistance levels.
SMA Crossover events can be used to filter bullish or bearish breakout alerts.
Supports alerts for entries and exits based on breakouts of local extrema.
Alerts can be generated at every breakout or with SMA crossover filtering active.
Backtests would suggest that filtering with SMA crossovers often yields slightly lower profit but with a considerable improvement to profit factor.
Green/Red indicates long/short entry
Yellow/Orange indicates long/short exit
See here for an example backtest and visualization of active SMA signal filtering:
For paper trading only. Do not use on real markets. Never make investment decisions based on this indicator alone.

TMA Indicator v2.1This indicator is designed to show support and resistance at local extremes.
Indicator can be configured to filter out bullish vs bearish resistance levels based on configurable parameters.
Supports alerts for entries and exits based on breakouts of local extrema.
Green/Red indicates long/short entry
Yellow/Orange indicates long/short exit
Backtest window: Jan 1, 2015 - Jul 21, 2019 (today)
For paper trading only. Do not use on real markets. Never make investment decisions based on this indicator alone.

Opening Range Breakout - ORBThe opening range is simply the high and low of a given period after the market opens. This period is generally the first 30 minutes or the first hour of trading.
During this period, you want to identify the high and low of the day. In addition, you will also want to account for the pre-market highs and lows, as these levels will often act like a magnet on price action after the bell rings.
Since the opening bell is associated with big trading volumes and volatility, this time of the session provides many trading opportunities. In this manner, traders use the opening range to set entry points on the chart and to forecast the price action for the day.

Combo Strategy 123 Reversal & Breakout Range Short This is combo strategies for get a cumulative signal.
First strategy
This System was created from the Book "How I Tripled My Money In The
Futures Market" by Ulf Jensen, Page 183. This is reverse type of strategies.
The strategy buys at market, if close price is higher than the previous close
during 2 days and the meaning of 9-days Stochastic Slow Oscillator is lower than 50.
The strategy sells at market, if close price is lower than the previous close price
during 2 days and the meaning of 9-days Stochastic Fast Oscillator is higher than 50.
Second strategy
Breakout Range Short Strategy
WARNING:
- For purpose educate only
- This script to change bars colors.

Combo Strategy 123 Reversal & Breakout Range Long This is combo strategies for get a cumulative signal.
First strategy
This System was created from the Book "How I Tripled My Money In The
Futures Market" by Ulf Jensen, Page 183. This is reverse type of strategies.
The strategy buys at market, if close price is higher than the previous close
during 2 days and the meaning of 9-days Stochastic Slow Oscillator is lower than 50.
The strategy sells at market, if close price is lower than the previous close price
during 2 days and the meaning of 9-days Stochastic Fast Oscillator is higher than 50.
Second strategy
Breakout Range Long Strategy
WARNING:
- For purpose educate only
- This script to change bars colors.

VWMA/SMA Breakout and Divergence DetectorThis indicator compares four different values :
-Fast Simple Moving Average(SMA)
-Fast Volume Weighted Moving Average(VWMA)
-Slow SMA
-Slow VWMA
Comparing SMA's and VWMA's of the same length is a common trading tactic. Since volume is not taken into consideration when calculating Simple Moving Averages, we can gain valuable insights from the difference between the two lines.
Since volume should be increasing along with an upwards price movement, the VWMA should be greater than the SMA during a volume-supported uptrend. Thus, we can confirm an uptrend if the VWMA remains greater than the SMA. If the VWMA falls under the SMA in the midst of an upwards price movement, however, that indicates bearish divergence. The opposite is true for downtrends. If price is decreasing and volume is decreasing at the same time (as it should), then we can confirm the downtrend.
Interpreting the Graph:
If the slow SMA is greater than the slow VWMA, then the area representing the difference between the two lines is filled in red. If the slow VWMA is greater than the slow SMA, however, the area between the two is filled green.
If the fast SMA is greater than the fast VWMA, then the area between the two dotted lines is filled in red. On the other hand, the area will be filled green if the fast VWMA is greater than the slow SMA.
In addition to spotting divergences and confirming trends, the four lines can be used to spot breakouts. Typically, a VWMA crossover will precede the SMA crossover. When the fast VWMA crosses over the slow VWMA and then a SMA crossover follows shortly after, then it is a hint that a bullish trend is beginning to form.

IZS - Intelligent Zone SelectorEnglish:
Better in volatile stocks, may fail in low volume. Aims to select safe zones to hold and stop in any danger. However, you are responsible for any loss
Türkçe:
Volatil hisselerde daha iyi çalışır, düşük hacimlerde başarısız olabilir. Hisse taşımak için güvenli bölgeyi seçmek ve herhangi bir tehlikede stoplamayı amaçlar. Ancak oluşabilecek zararlardan herkes kendisi sorumludur.


HV ID/ND4 BreakoutThis indicator is based on Linda Raschke's ID/ND4 Historical Volatility Breakout strategy. It finds days where the high and low are within the previous day high and lows (Inside days), that have also, the narrowest trading range within the last 4 days (it basically checks if the current day has the narrowest range comparing it with the previous 3 days) when the short term historical volatility (6 period default) is relatively low compared to the longer term historical volatility (100 period default) (The condition is that the 6/100 Historical volatility is below 50% of its annual range).
More information about how to trade this strategy is described in the book but basically, you would want to place a resting buy and sell stops at the high and low of the day highlighted and enter if you get filled the next day.


_SP(viaCM)_Opening-Range-FinalChris Moody's script. I just lessened the line/circle width, got rid of the highlighting overall, and reduced the highlighting between OR high and OR low.
Flagging BandsIntroduction
A pun between the word flag and the adjective flagging (less dynamic) , this indicator have two bands who react faster when in contact to the price. Imagine you are under sheets, if you abruptly rise, the sheets will instantaneously go up, then if you abruptly get down, the sheets will fall slowly until being in contact with a surface, this is because of a type of friction called drag or air resistance , this force is described in fluid dynamics and i inspired myself from that for the creation of the indicator.
The indicator
The indicator is made of two bands, one upper band and one lower band, then a weighted average of each bands, this average is weighted depending on which band the price is closer. The length control the period of the indicator, in general higher lengths will create wider bands, you must consider that this parameter behave differently than other ones and may create slower results in comparison with other bands indicators while having the same length period.
The indicator can use a simple breakout methodology (see trailing stop part) but can sometime provide support and resistance points, in fact i believe that when the average variability/volatility of band A is higher than the average variability/volatility of band B and that the price cross band B then price will reverse its direction, this claim is not justified, research is needed.
Trailing Stop Mod
It is possible to make the indicator act as a trailing stop, in order to do so just tick the trailing stop mod box.
The average/bands will automatically disappear being replaced by the trailing stop.
Conclusion
I was just playing around when making the skeleton of the indicator, i hope the code is easy to understand, if you need some kind of explanation just pm me, i'm always open to help people/receive suggestions.
Best Regards
